Occupancy Analytics
Introduction
infsoft’s analysis functionalities can be based on an existing positioning solution (client-based or server-based) or set up independently. Depending on the application scenario, occupancy analysis can refer to a workstation, room resources or areas, specify the evaluation of walking routes or visualize the utilization level of machines.
Especially with regard to space management and facility services, utilization analyses generate relevant data for business decisions. The focus here is on optimizing space utilization and integrating services such as demand-oriented cleaning, e.g. of workstations, meeting rooms and restrooms.
Utilization analyses in connection with location data (e.g., from infsoft Lead Time Tracking) also provide helpful insights for the portfolio management of managed assets. The solution can rely on tag hardware (Wi-Fi, BLE, RFID and UWB) and measures via complementary motion sensors or power consumption measurement, at what time, at which location assets have been used. The data is presented in a clear web interface in the form of diagrams and heat maps, making it easy to evaluate and further process the data. Independently of or in addition to a localization, evaluations can also be made on the basis of sensor data.
Hardware for Occupancy Analytics
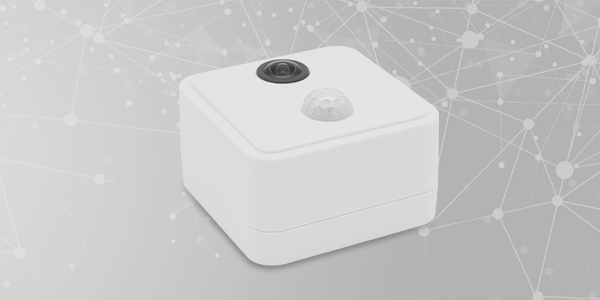
infsoft AI Occupancy Sensor
The infsoft AI Occupancy Sensor offers reliable occupancy detection using a combination of an optical sensor and a PIR module. The infsoft AI Occupancy Sensor enables intelligent person and object detection, in which the images triggered by the sensor are analyzed and evaluated using artificial intelligence in compliance with data protection regulations. The optical sensor can be triggered at fixed time intervals or ad hoc by the integrated PIR sensor when motion is detected.

The infsoft AI Occupancy Sensor is able to recognize passive occupancy indicators such as laptops, keyboards and their changed arrangements and mark the corresponding workstation or room resource as occupied without the physical presence of people.
Infrastructure Hardware
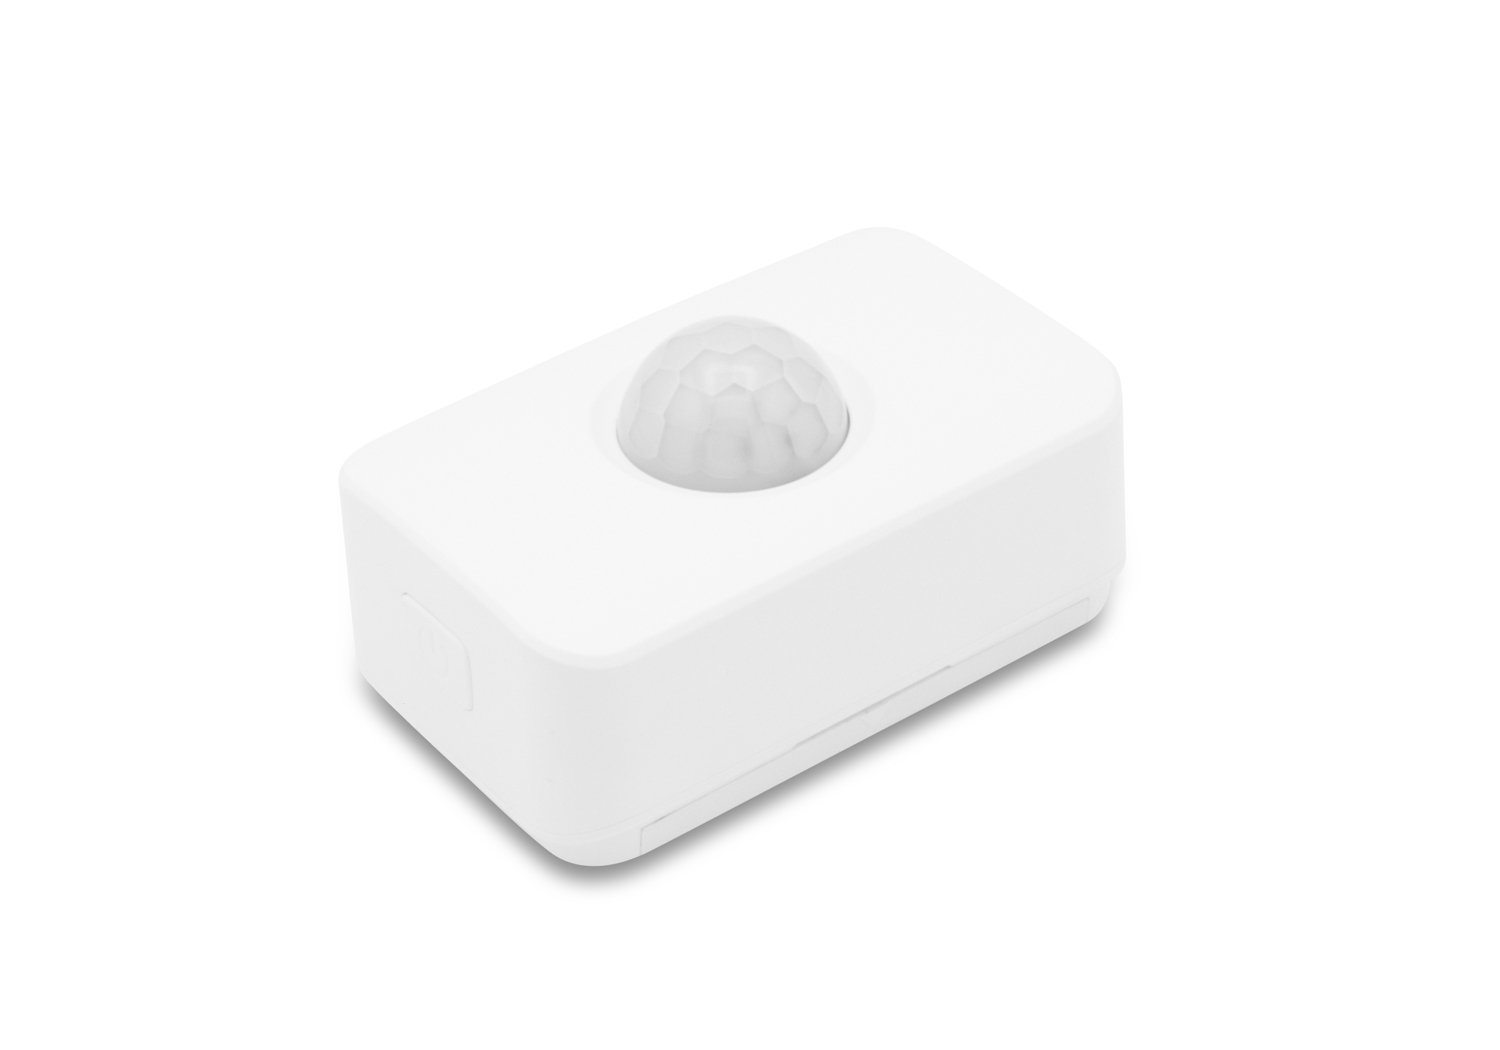
PIR Sensors
Passive Infrared Sensors (PIR Sensors) are usually mounted beneath desks to detect movement in order to provide basic occupancy detection (yes/no human presence).
The sensor has an adjustable sensitivity. In order to prevent incorrect occupancy messages in the case of short-term detection, backend business logic is utilized.
BLE Tags
BLE tags are usually used to analyze movement flows. These can be attached to objects for the purpose of asset tracking. BLE wearables in the form of wristbands or ISO cards are suitable for tracking the movements of people. Server-based positioning is most commonly applied.
BLE tags can also be equipped with sensors, such as a motion sensor. This enables the registration of whether a chair/table is in use or the corresponding workplace is available. The solution is cost-effective and also does not collect any personal data sets. In addition, evaluations can be provided with further display filters (no visualization <5 pax).
Additional information about the room climate can be collected with permanently installed sensor beacons.
In all cases, additional infrastructure hardware is required to send the signals to the backend.
Deployed Software

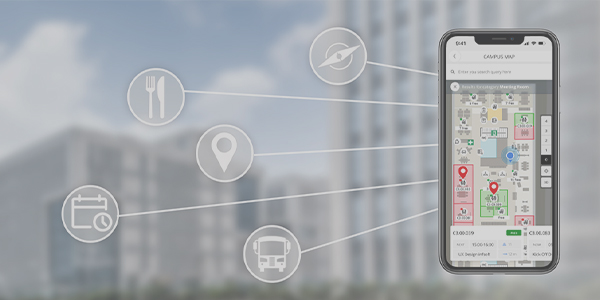
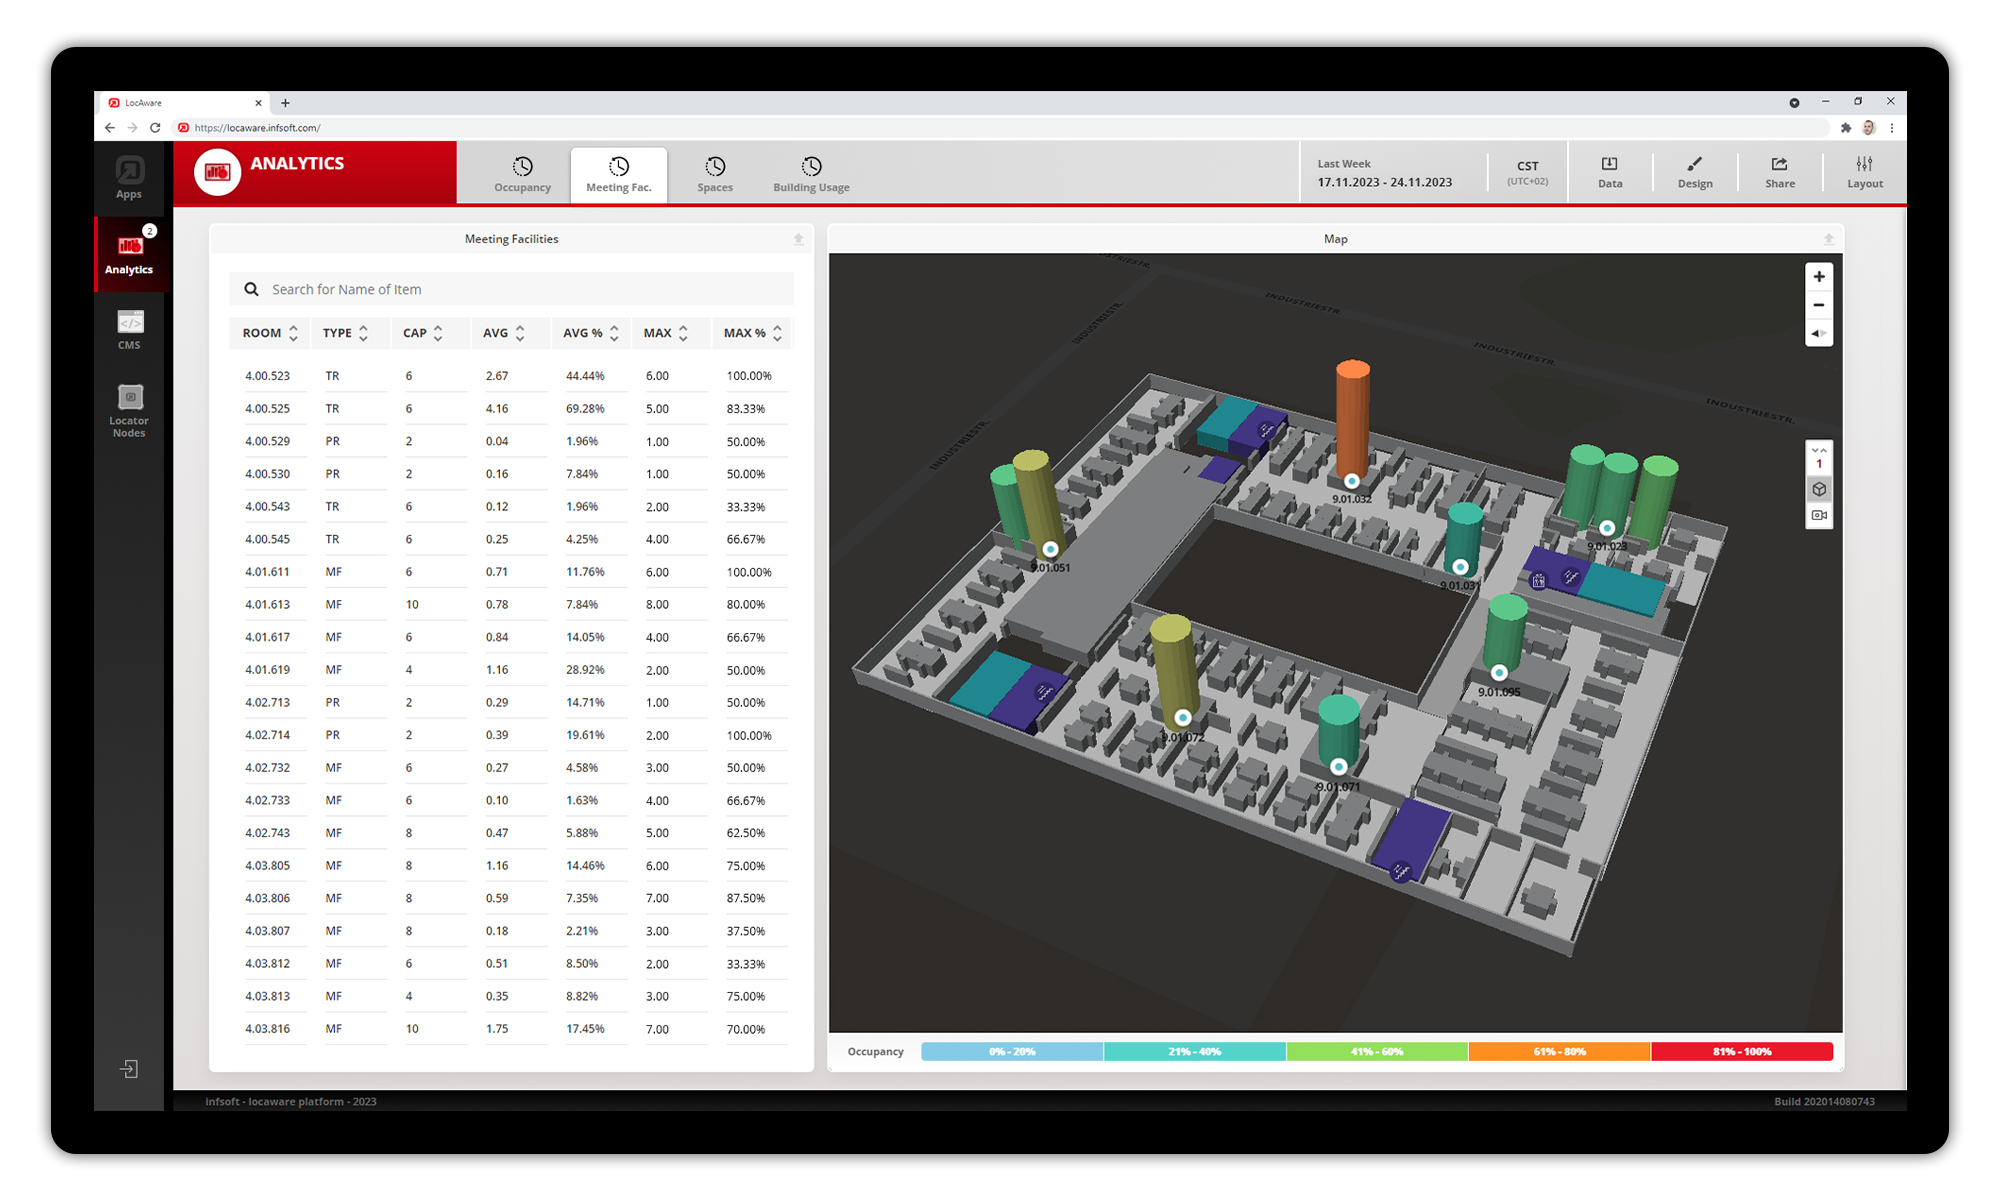
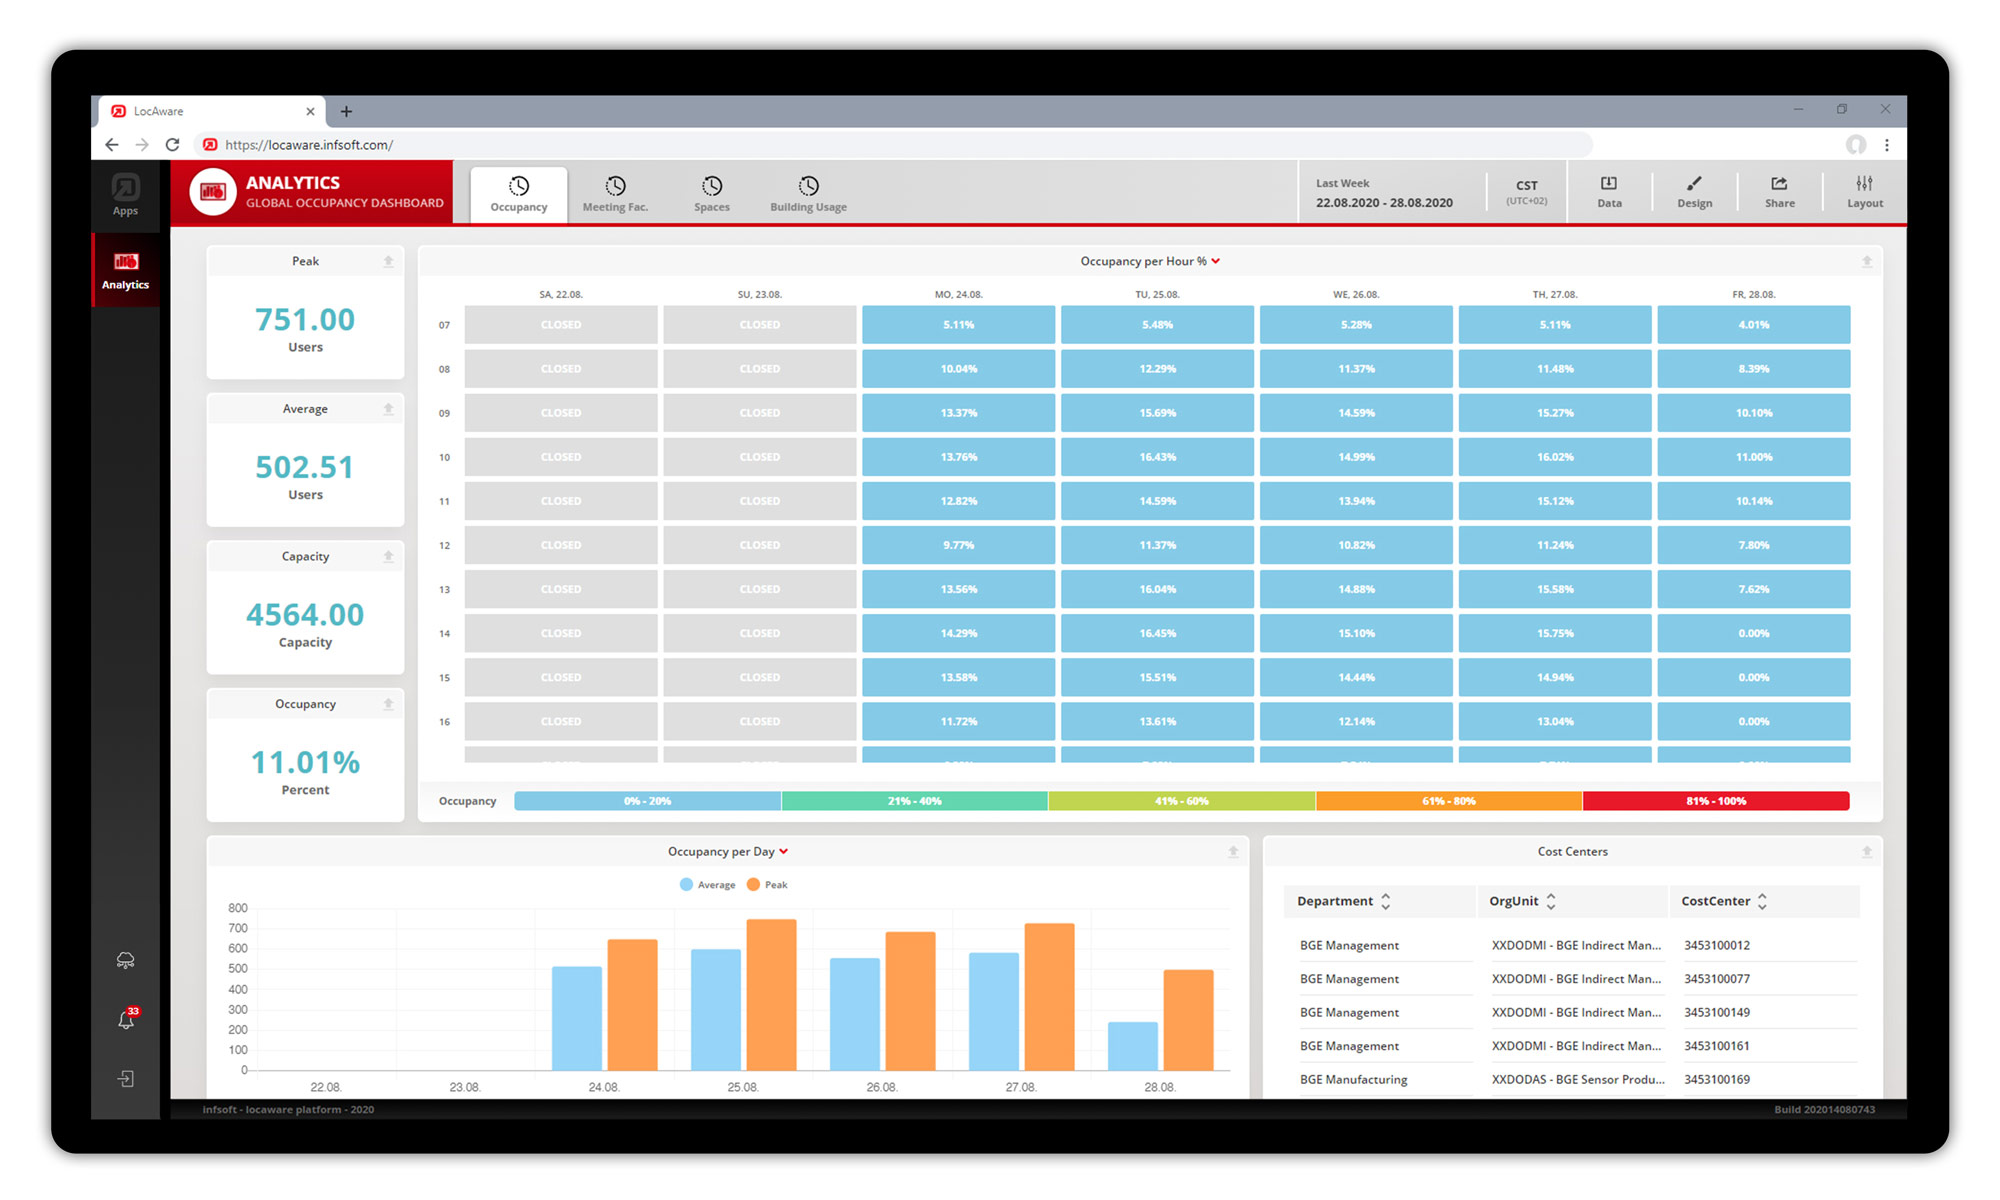
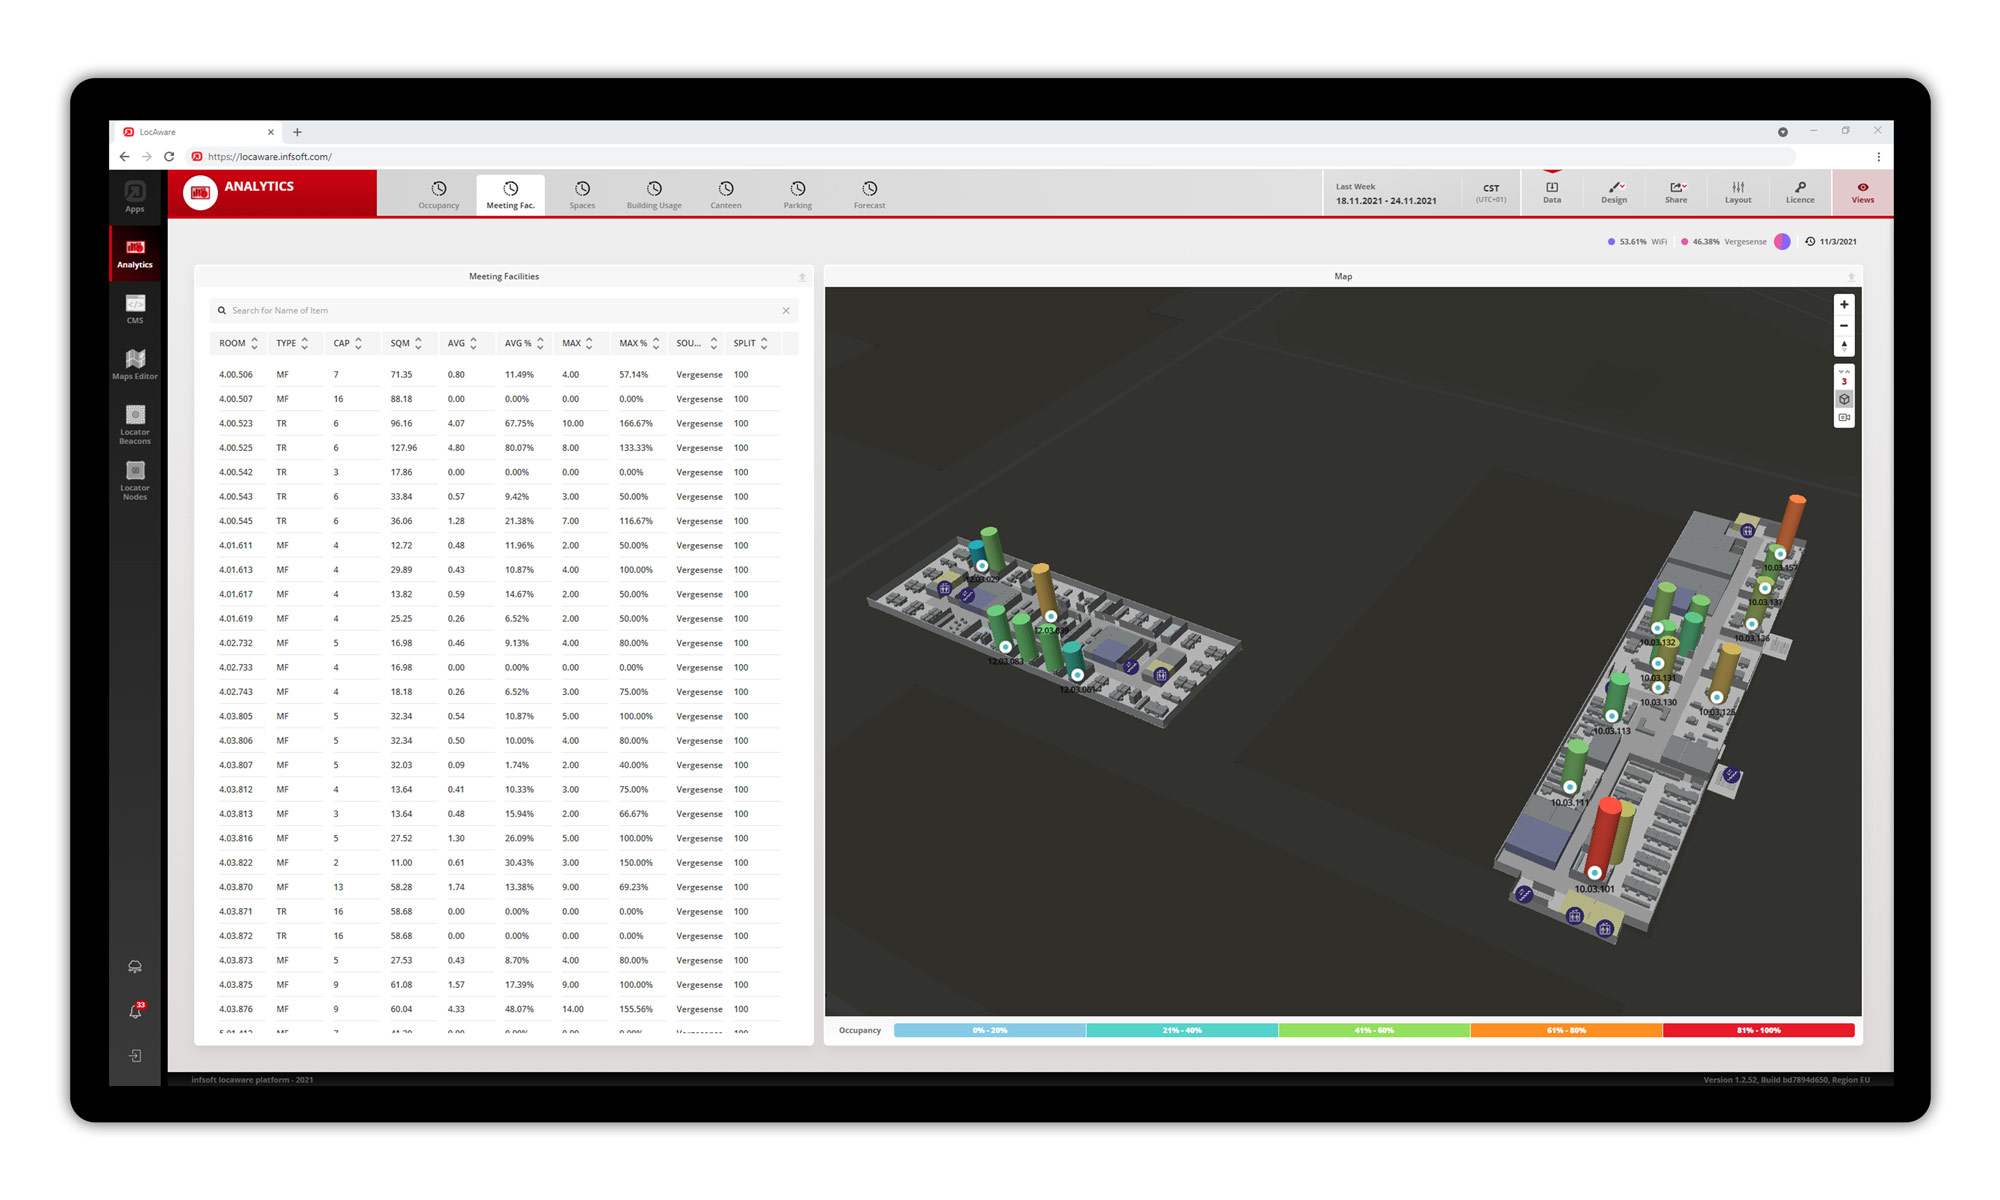
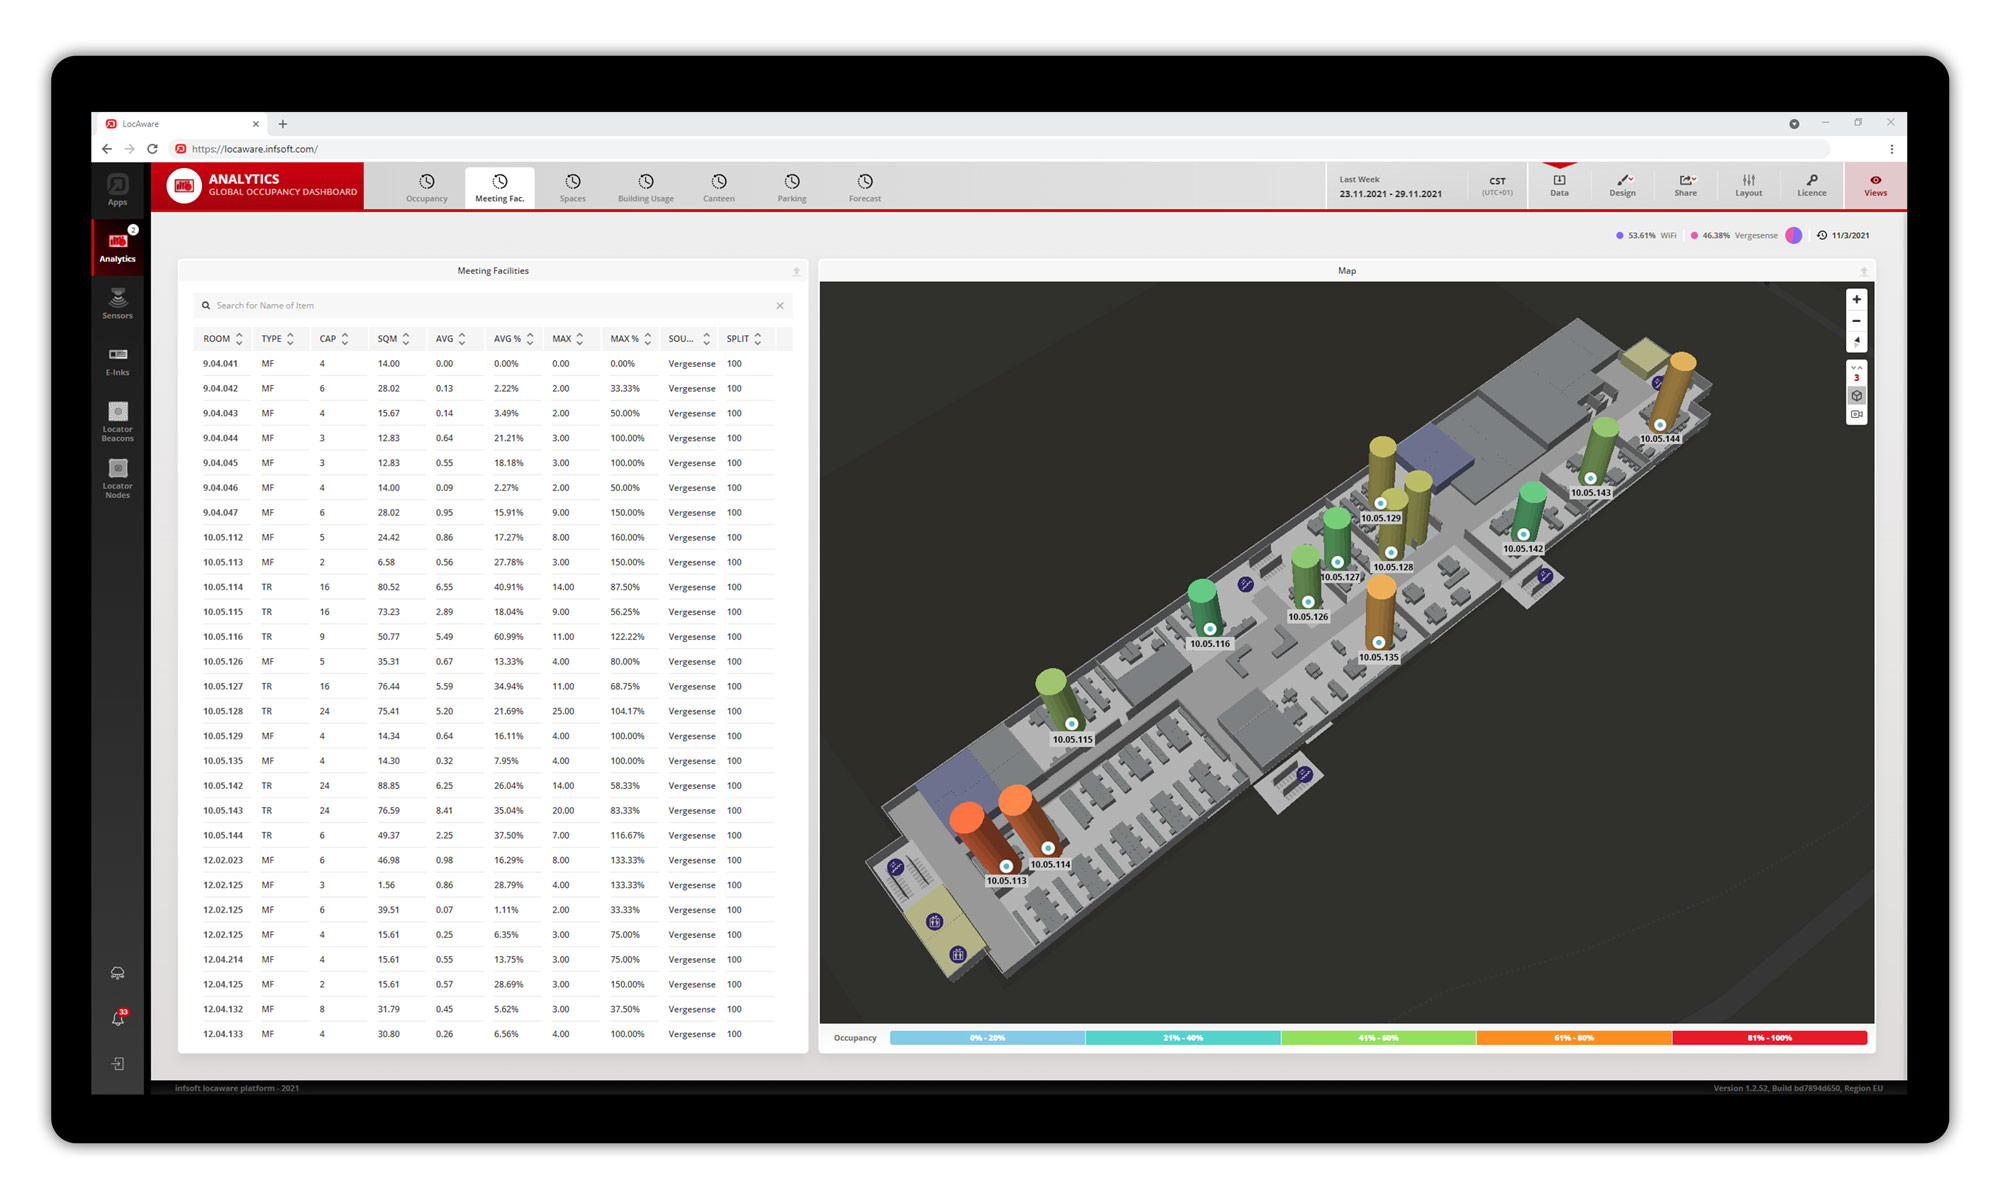
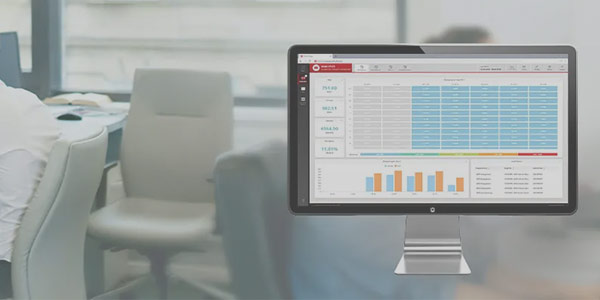
The application possibilities of occupancy analytics are diverse and can be implemented in a wide range of industries. On a factory site, for example, the visualization of driving and walking routes is possible. In a hospital, the utilization of beds and medical equipment can be determined over time. Analyses in offices help to obtain an overview of the use of individual workplaces and meeting rooms. The collected data can be viewed in infsoft Analytics. Various dashboards are available for this purpose, which can be customized to meet specific needs.
Integration with Third-Party Systems
Sensor Systems (XOVIS)
In addition to capturing data via beacons with motion sensors, data from third-party sensor systems such XOVIS can also be connected to the infsoft LocAware platform® via interfaces. The data is then displayed and analyzed in a clear and personalizable dashboard in infsoft Analytics.
Data from third-party systems (e.g. XOVIS) can be acquired via an interface.
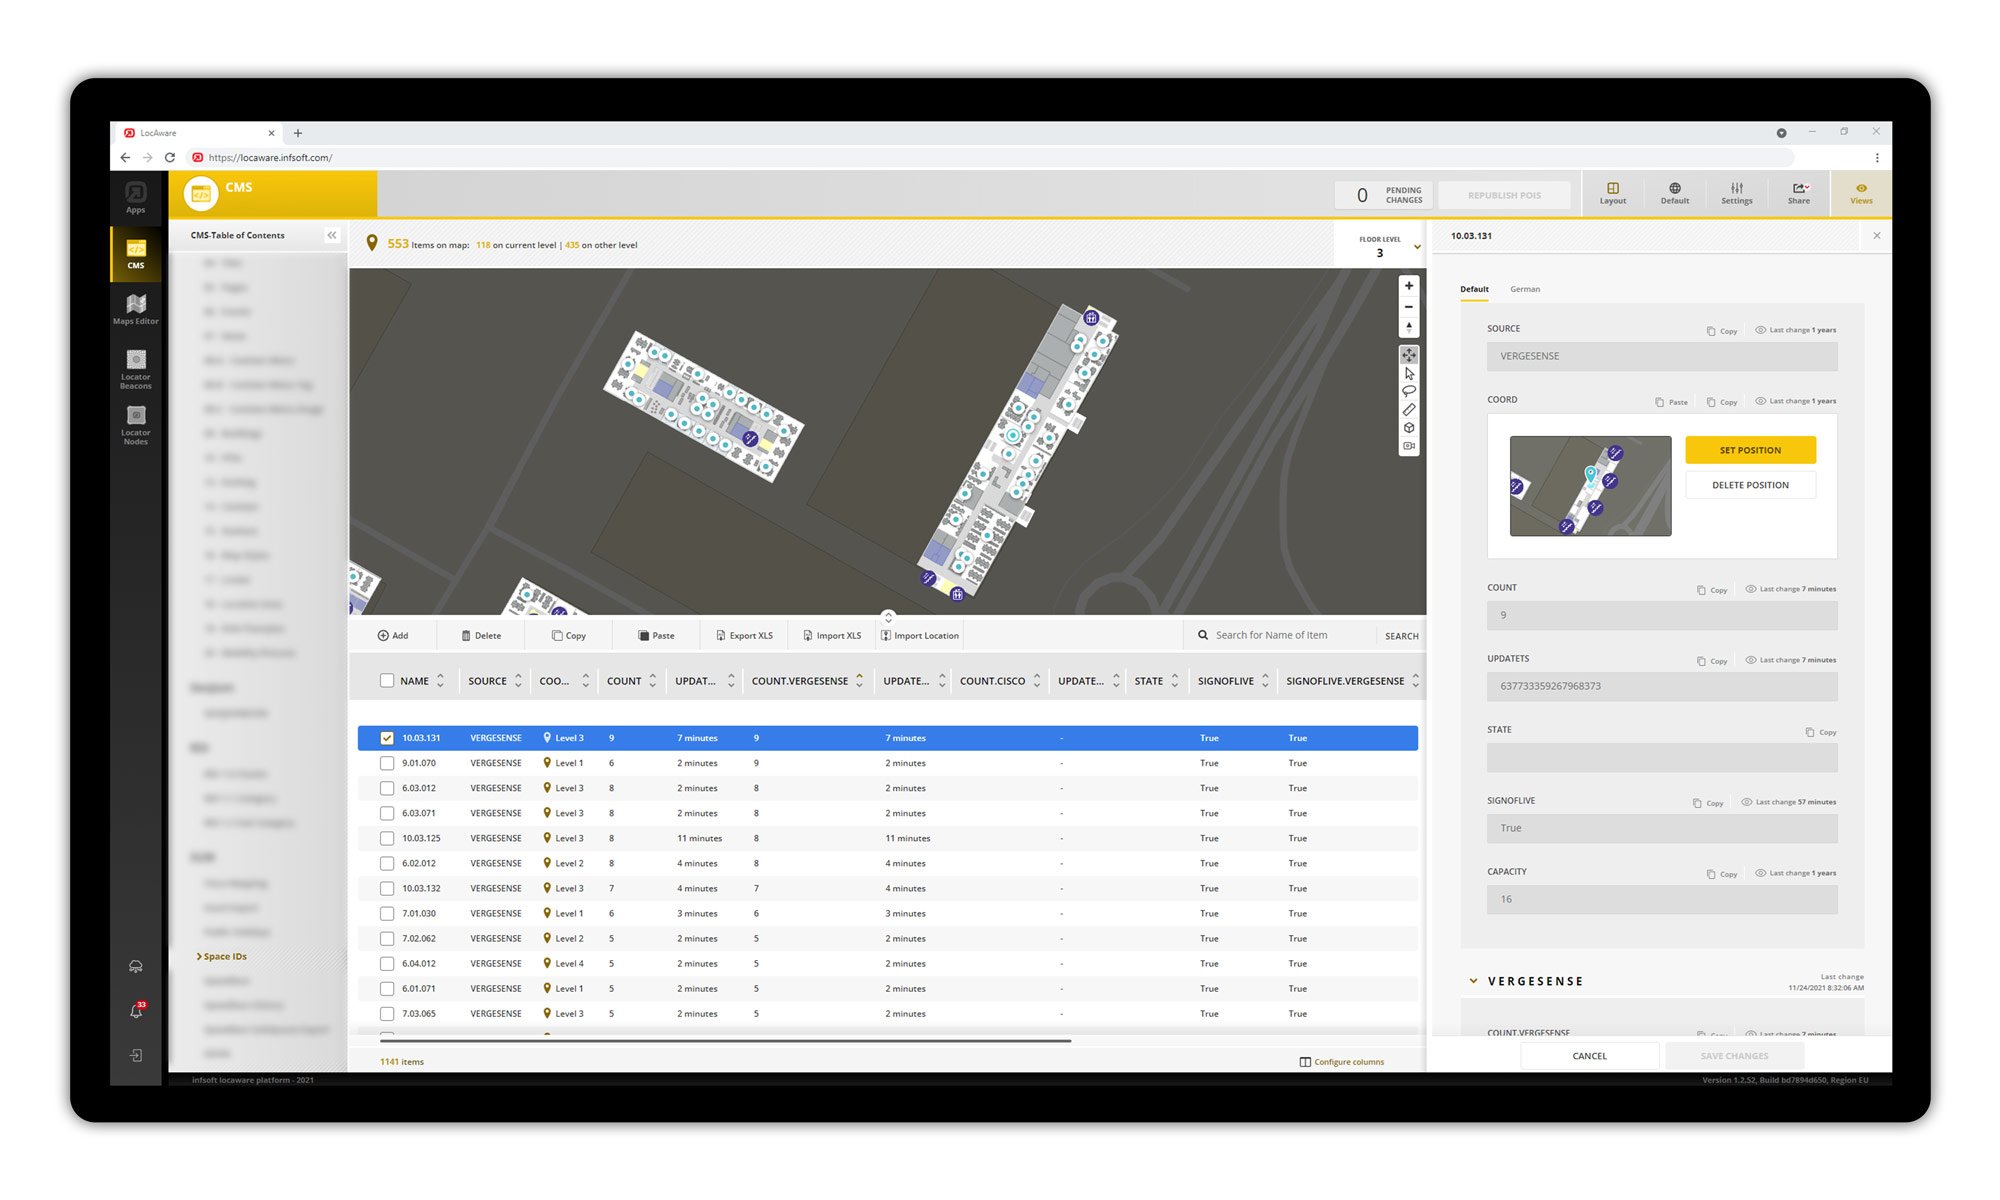
The sensor data is referenced to the building plans in the infsoft CMS.
The visualization of the utilization statistics and heat maps is mapped in infsoft Analytics.
Wi-Fi Data
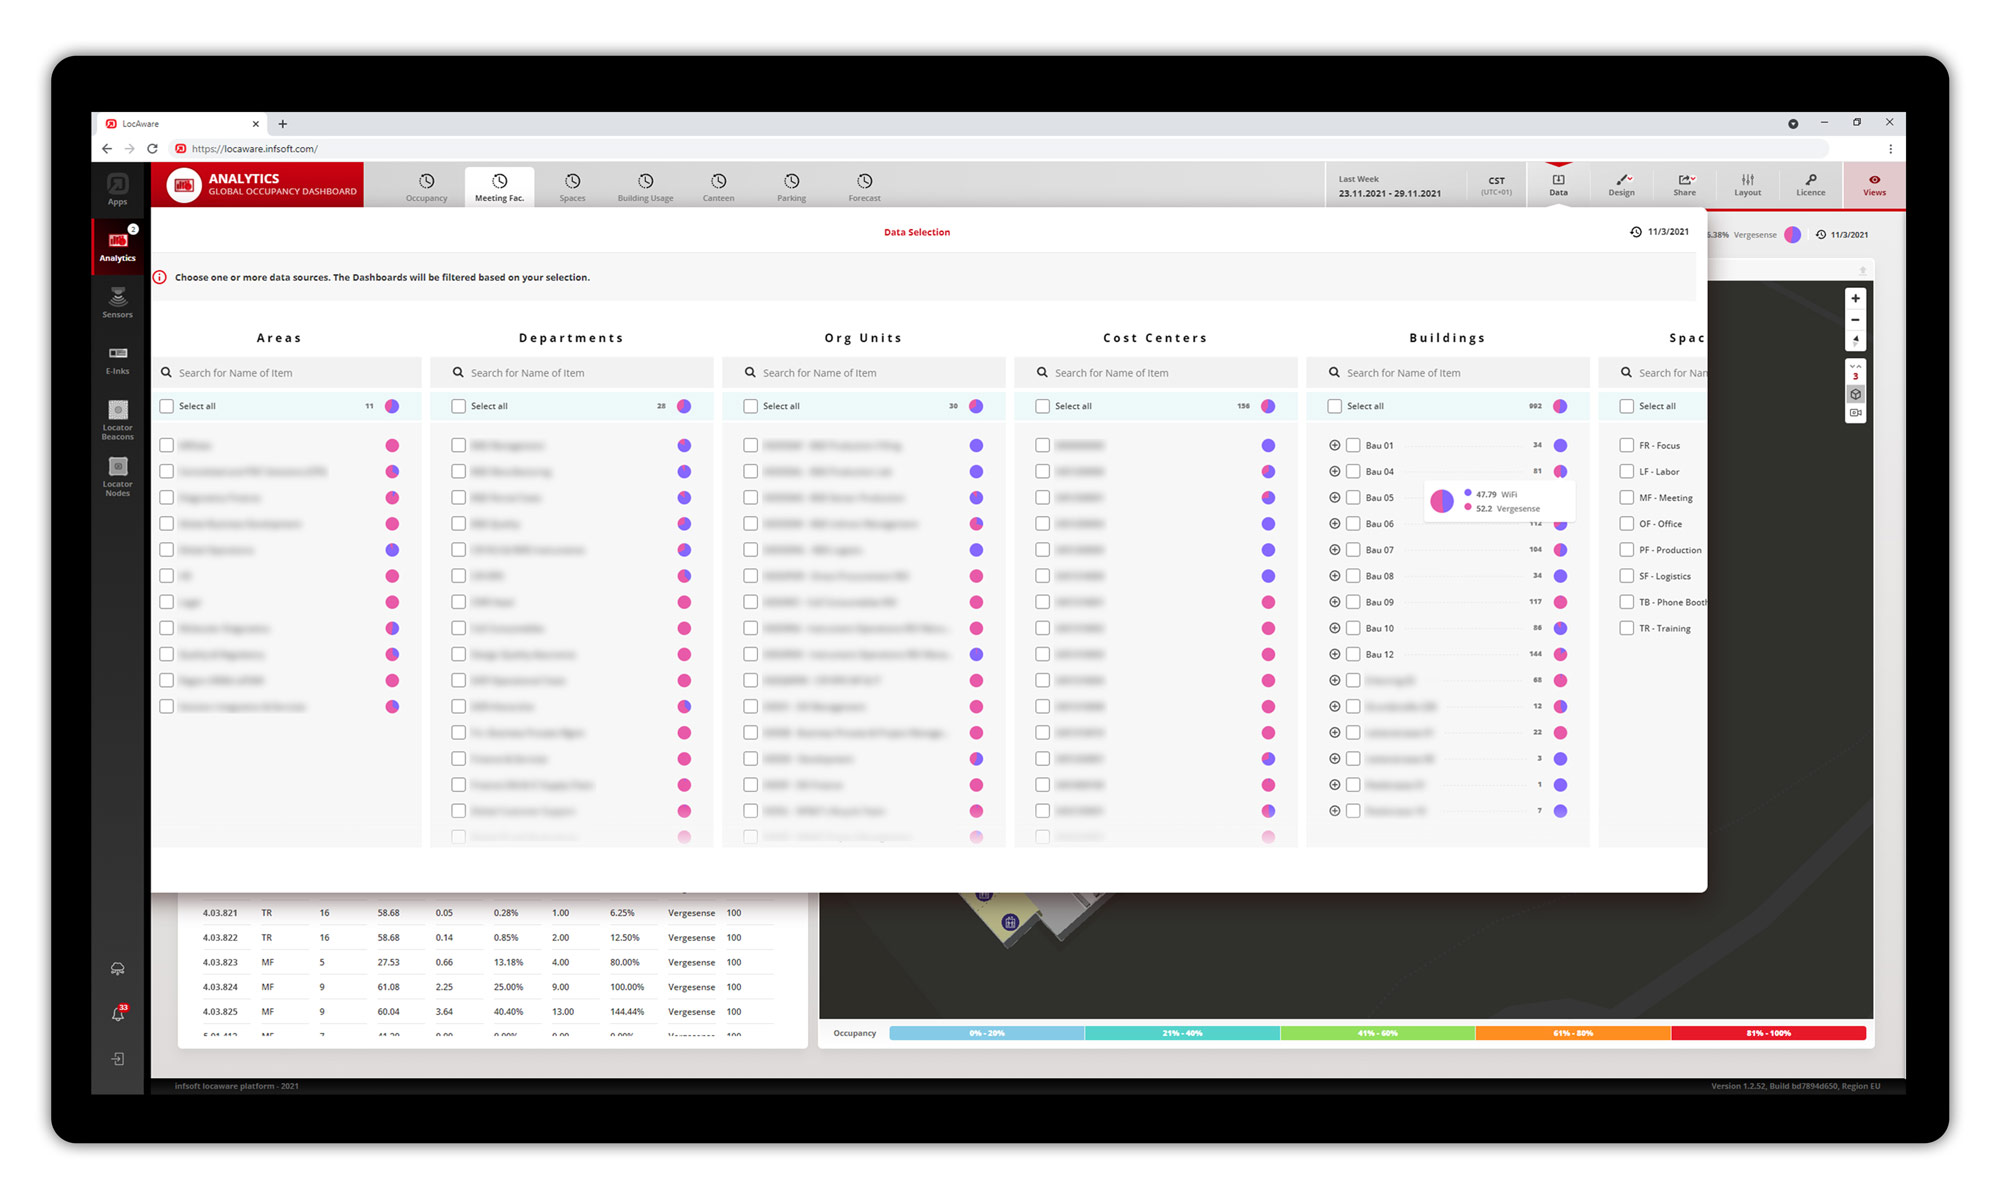
By combining different sensor sources, it is possible to generate more in-depth area demand analyses. Anonymized login data from company devices in the Wi-Fi network can be used as a data source, e.g., provided via the existing Cisco access point infrastructure.
Multiple counts are filtered out using the existing identifiers and the data is mapped in the infsoft LocAware platform®. infsoft Occupancy allows the user to apply different filters to the data and compare them with each other.
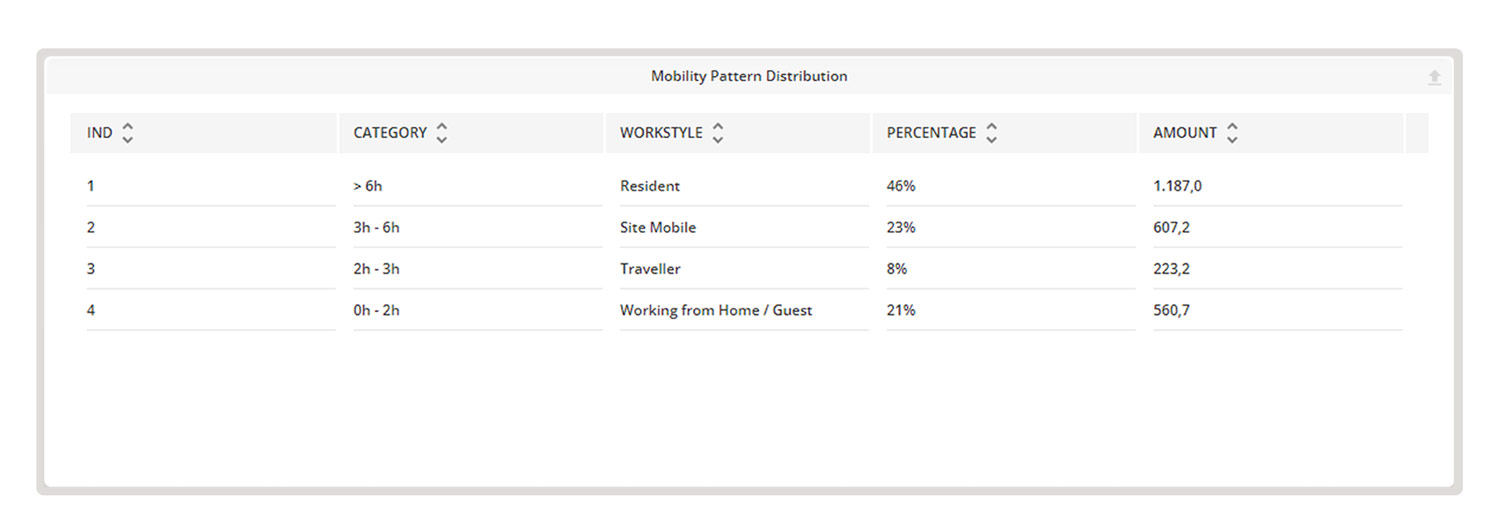
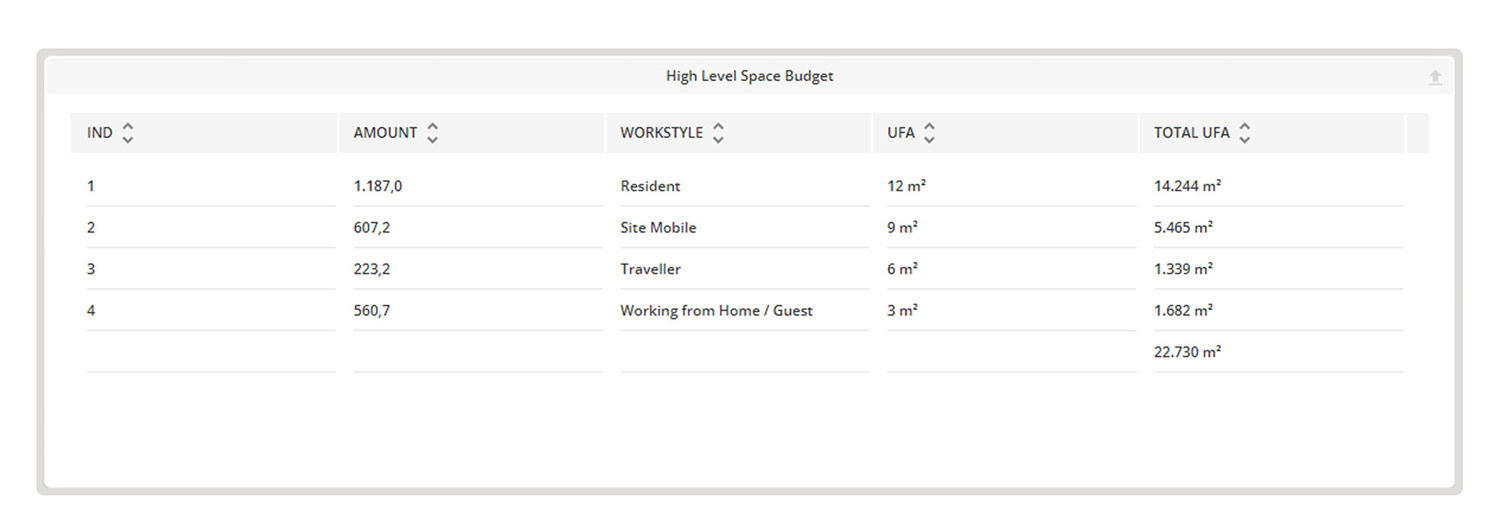
Based on the data provided and associated dwell times, mobility patterns with associated work styles can be created. As a result of the analysis of the work styles and associated qm per style, a space requirement can be derived that includes other attributes such as overcrowding factors.
Implementation in infsoft Products
Occupancy analyses are implemented as part of our product infsoft Occupancy. In addition, occupancy analyses can complement other products in the office environment. On the one hand, there are great advantages for executives and other people in charge. On the other hand, employee satisfaction and productivity can be increased, for example by using a Workplace Experience App.
infsoft Occupancy
infsoft Occupancy provides reliable occupancy analyses of workstations and meeting rooms. Occupancy information is displayed in real time and over time in a comprehensive dashboard.
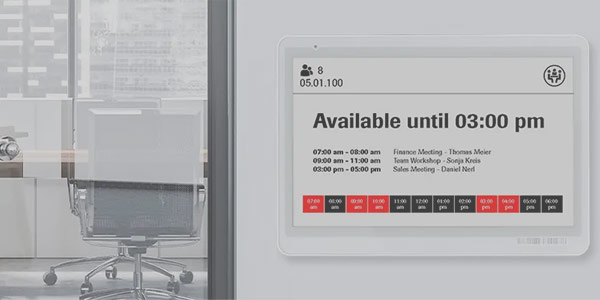
infsoft Room Signage
Based on space utilization data and the current occupancy of rooms and workstations, E-Ink displays that are installed outside meeting rooms and desk-sharing offices can also be labeled automatically.