infsoft Analytics
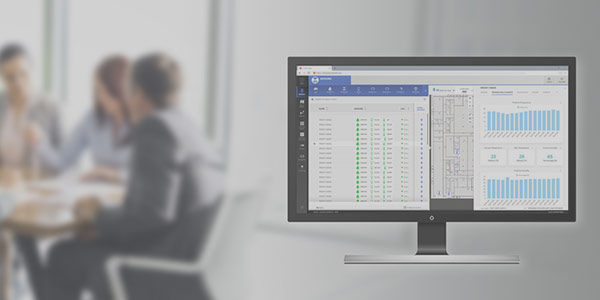
infsoft Analytics is a powerful analytics tool within the infsoft LocAware platform®, enabling the collection, visualization, and evaluation of movement and presence data – both in real time and retrospectively. The application supports a wide range of data sources and provides valuable insights for use cases such as space optimization, utilization patterns, and more.

Real-Time Insights
infsoft Analytics provides real-time visualization of location and usage data from various sources – whether from infsoft Locator Nodes (Wi-Fi, BLE, UWB), smartphone apps, or third-party infrastructures. Data is displayed in a privacy-compliant manner directly within the uploaded building layout, offering a clear view of current movement and occupancy patterns.
Configurable heatmaps, group visualizations, and custom views provide versatile options for visualizing and analyzing spatial movement data.

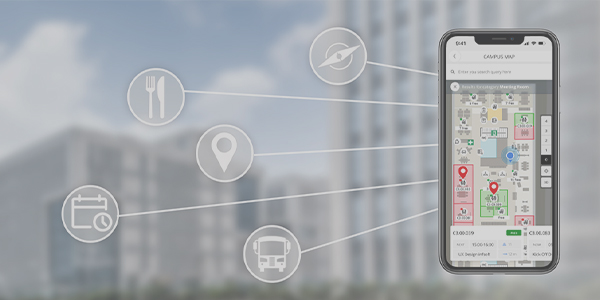
BLE Heatmapping & Path Analysis
The integrated BLE heatmapping allows smart devices with Bluetooth enabled to be captured and tracked in a privacy-compliant manner. This makes it possible to precisely measure movement paths, dwell times, and visitor frequency in specific areas.
These analyses provide valuable insights into space utilization – for example, to optimize routes, design workspaces, or manage visitor flow – supporting data-driven decisions in modern office, retail, and campus environments.

Frequency & Dwell Time Analysis
The tool provides precise information on usage frequency, dwell times, and peak periods in selected zones. These insights form the basis for optimizing space utilization, visitor flows, or workspace allocation.
By integrating the infsoft Automation Engine, follow-up actions can be triggered based on recorded events – such as notifications or automatic adjustments of system parameters.

Time- & Location-Based Analysis
Users can define custom time periods, locations, and parameters to perform targeted analyses. Key metrics such as foot traffic, dwell time, or waiting periods can be clearly compared using bar, line, or pie charts.
Flexible filtering and the combination of different metrics make infsoft Analytics a versatile tool for data-driven process optimization and operational decision support.

Historical Data Analysis & Comparison
In addition to live visualization, comprehensive historical analyses are available. Time periods spanning weeks or months can be examined to identify trends, evaluate measures, or generate forecasts.
This enables the detection of traffic patterns, seasonal fluctuations, and recurring usage behaviors – a crucial tool for strategic planning and sustainable efficiency improvements.

Transparency & Optimization
infsoft Analytics provides comprehensive insights into movement and usage patterns within buildings or sites. Whether for operational decisions, space optimization, or automated responses, the tool delivers relevant information through fully customizable reports.
As part of the infsoft LocAware platform®, it serves as a central instrument for data-driven organizations, laying the foundation for informed, transparent, and sustainably efficient operational processes.