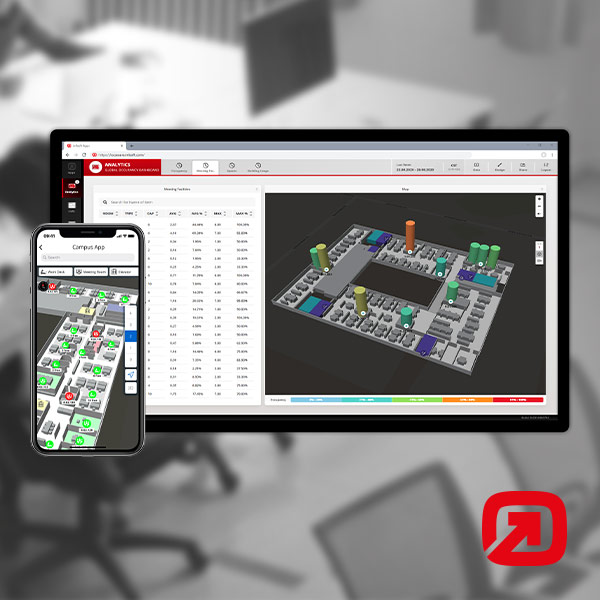
The Workplace Experience App offers a variety of different occupancy analytics as well as statistics for a wide range of application areas. Which occupancy data the app provides, as well as the way it is presented, will be outlined in more detail in this blog post.
In general, the utilization data is determined via appropriate sensor technology, such as movement or object recognition sensors, as well as on the basis of various booking information, and is visualized within the product infsoft Occupancy and the infsoft Analytics software solution. In addition to being displayed in infsoft LocAware’s Analytics Dashboard, the data is accessible via the Workplace Experience App.
Utilization data can be accessed in the Workplace Experience App for the following topics:
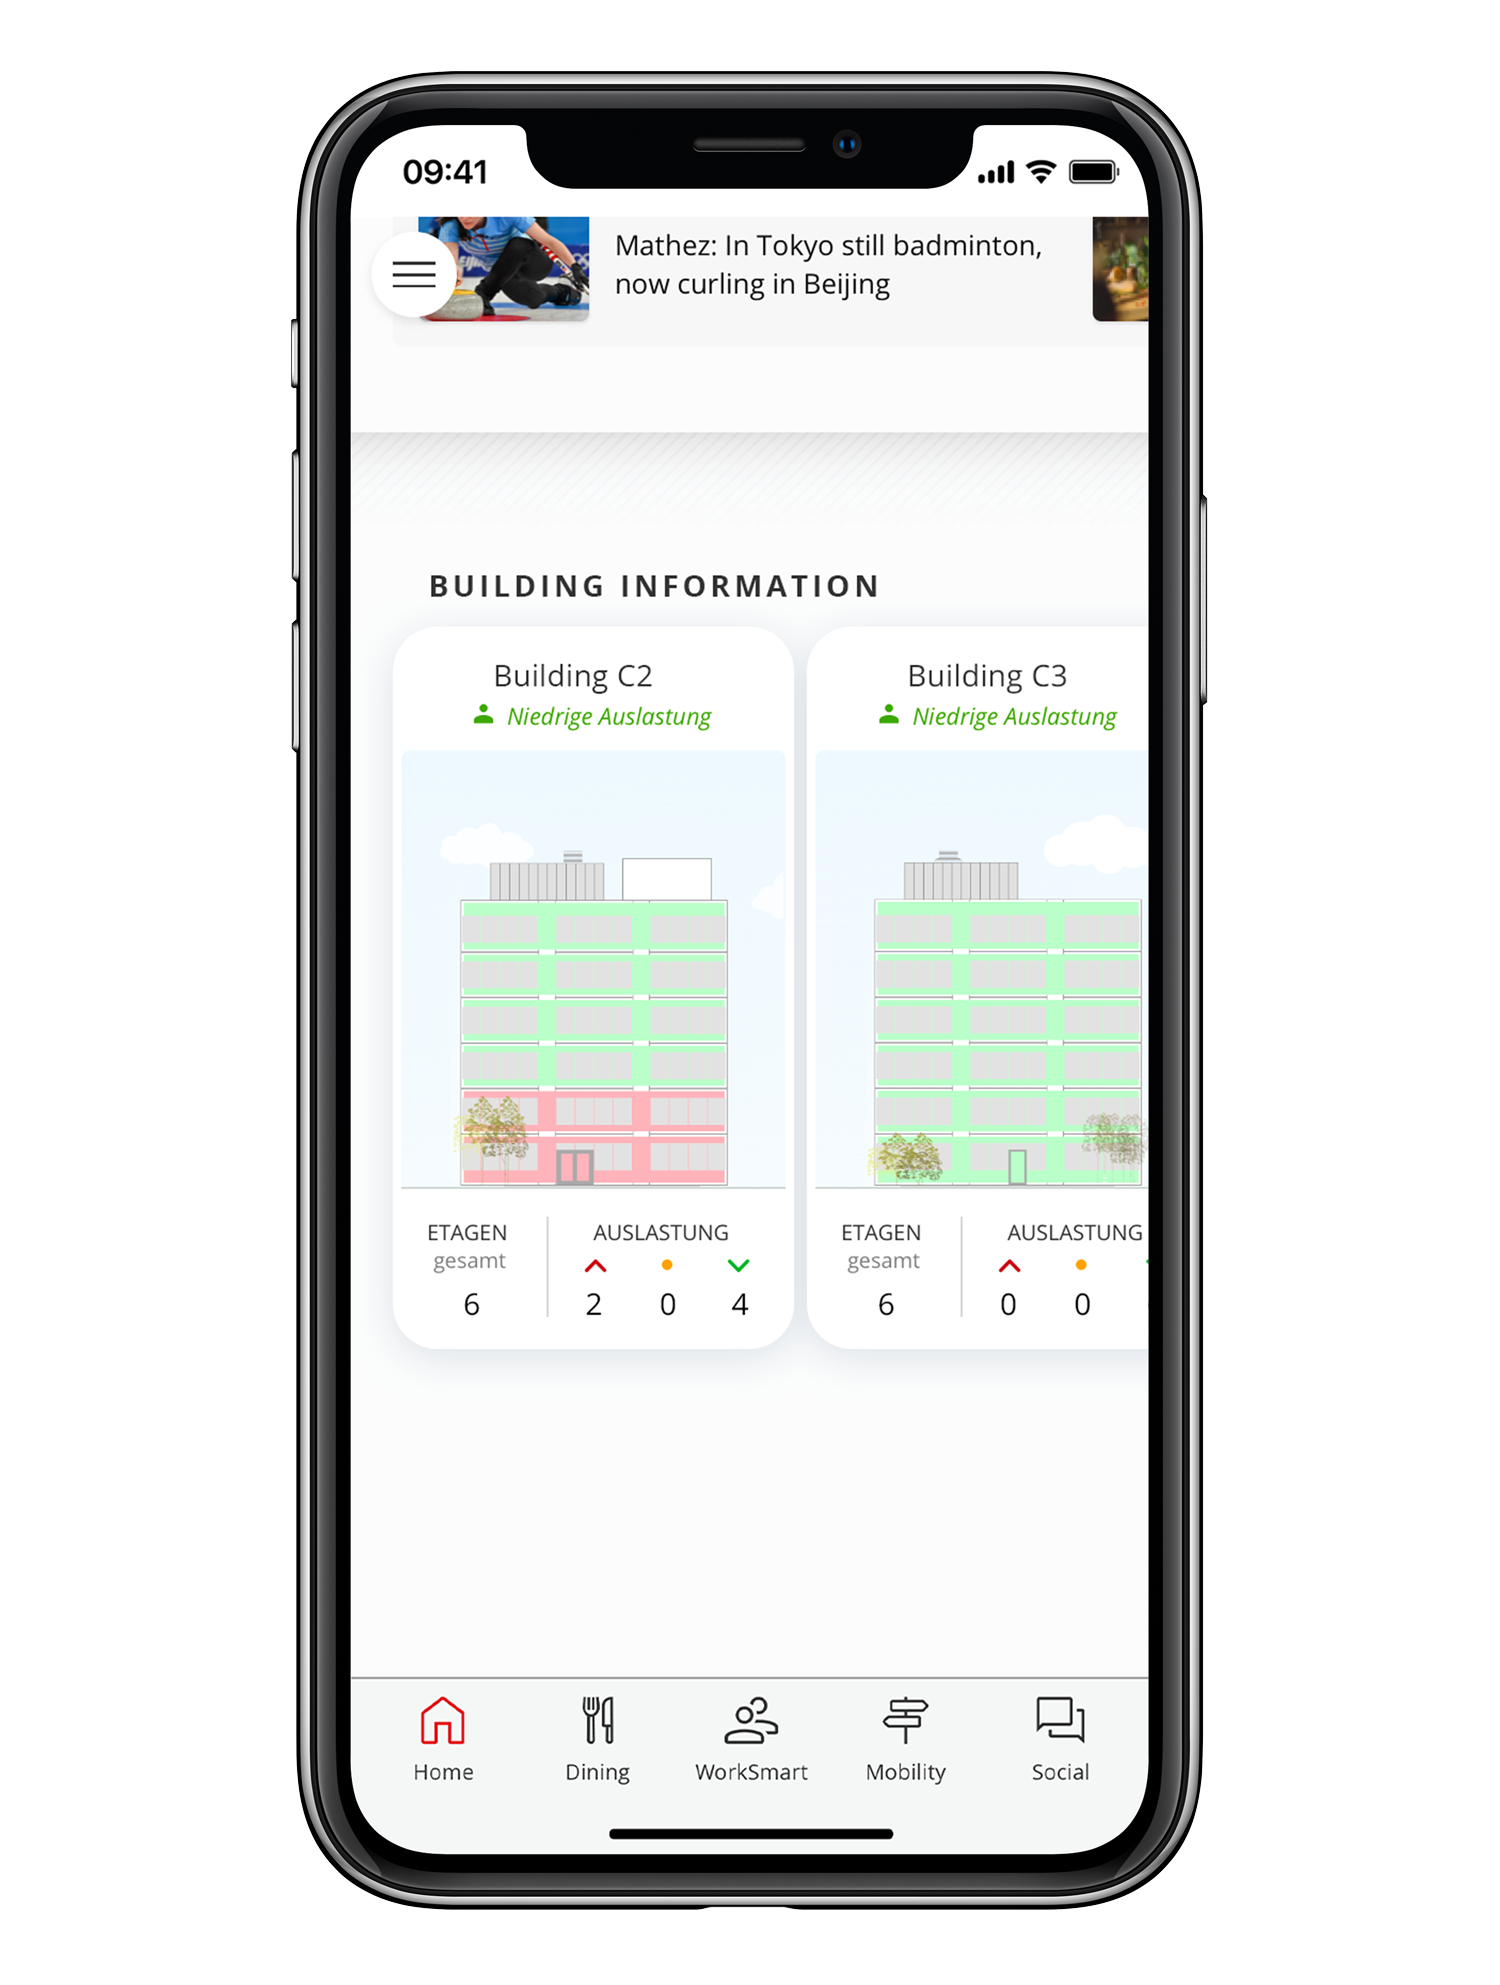
Building Occupancy
The users of the Workplace Experience app receive an occupancy display on the home screen of all buildings located on the company premises, which is displayed per floor. In addition, it is possible to prioritize buildings or floors individually as preferred by the user.
The determined analysis data is displayed using a color scale. Optionally, the user can view more precise numerical values for building utilization.
Workstation and Room Utilization
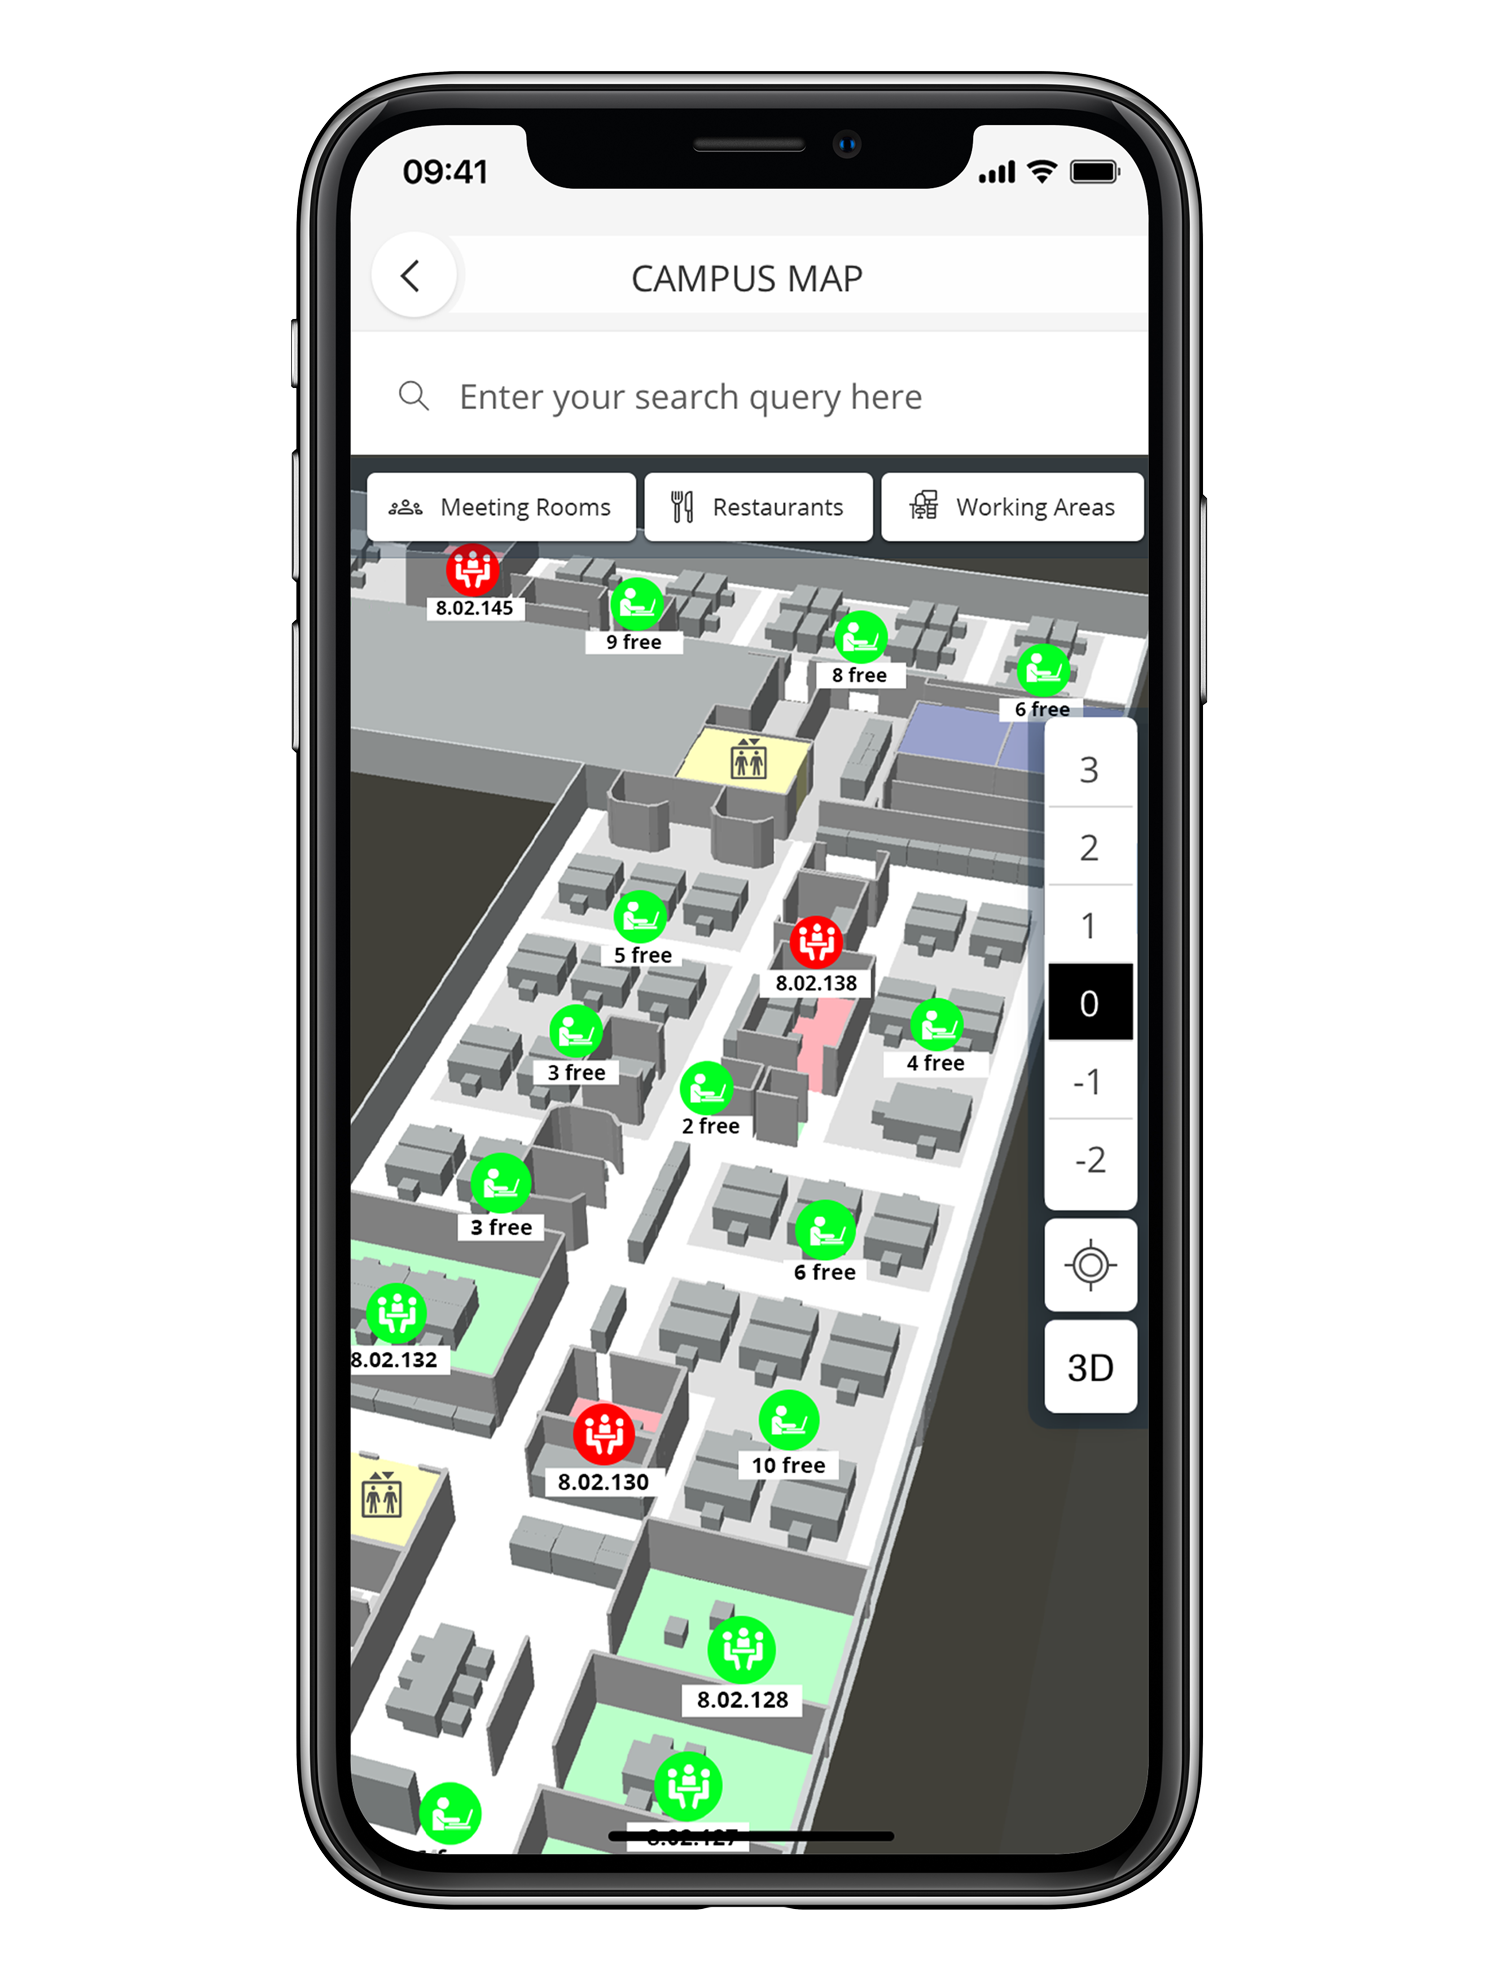
In addition to the option of booking a workplace or a meeting room, the Workplace Experience App also provides appropriate occupancy data. The user is offered live occupancy information on individual workstations and meeting rooms.
The visualization is done in two ways: on the one hand, the current capacity utilization is displayed on a digital map using the traffic light principle; on the other hand, the user finds a list view in the app where all workplaces or meeting rooms are listed according to filterable criteria and categorized as free or occupied. A color gradient indicates the availability of group workstations. Occupancy levels below 50% are displayed in green, while occupancy levels above 50% are displayed in orange. Fully reserved group workstations and occupied individual workstations are indicated in red.
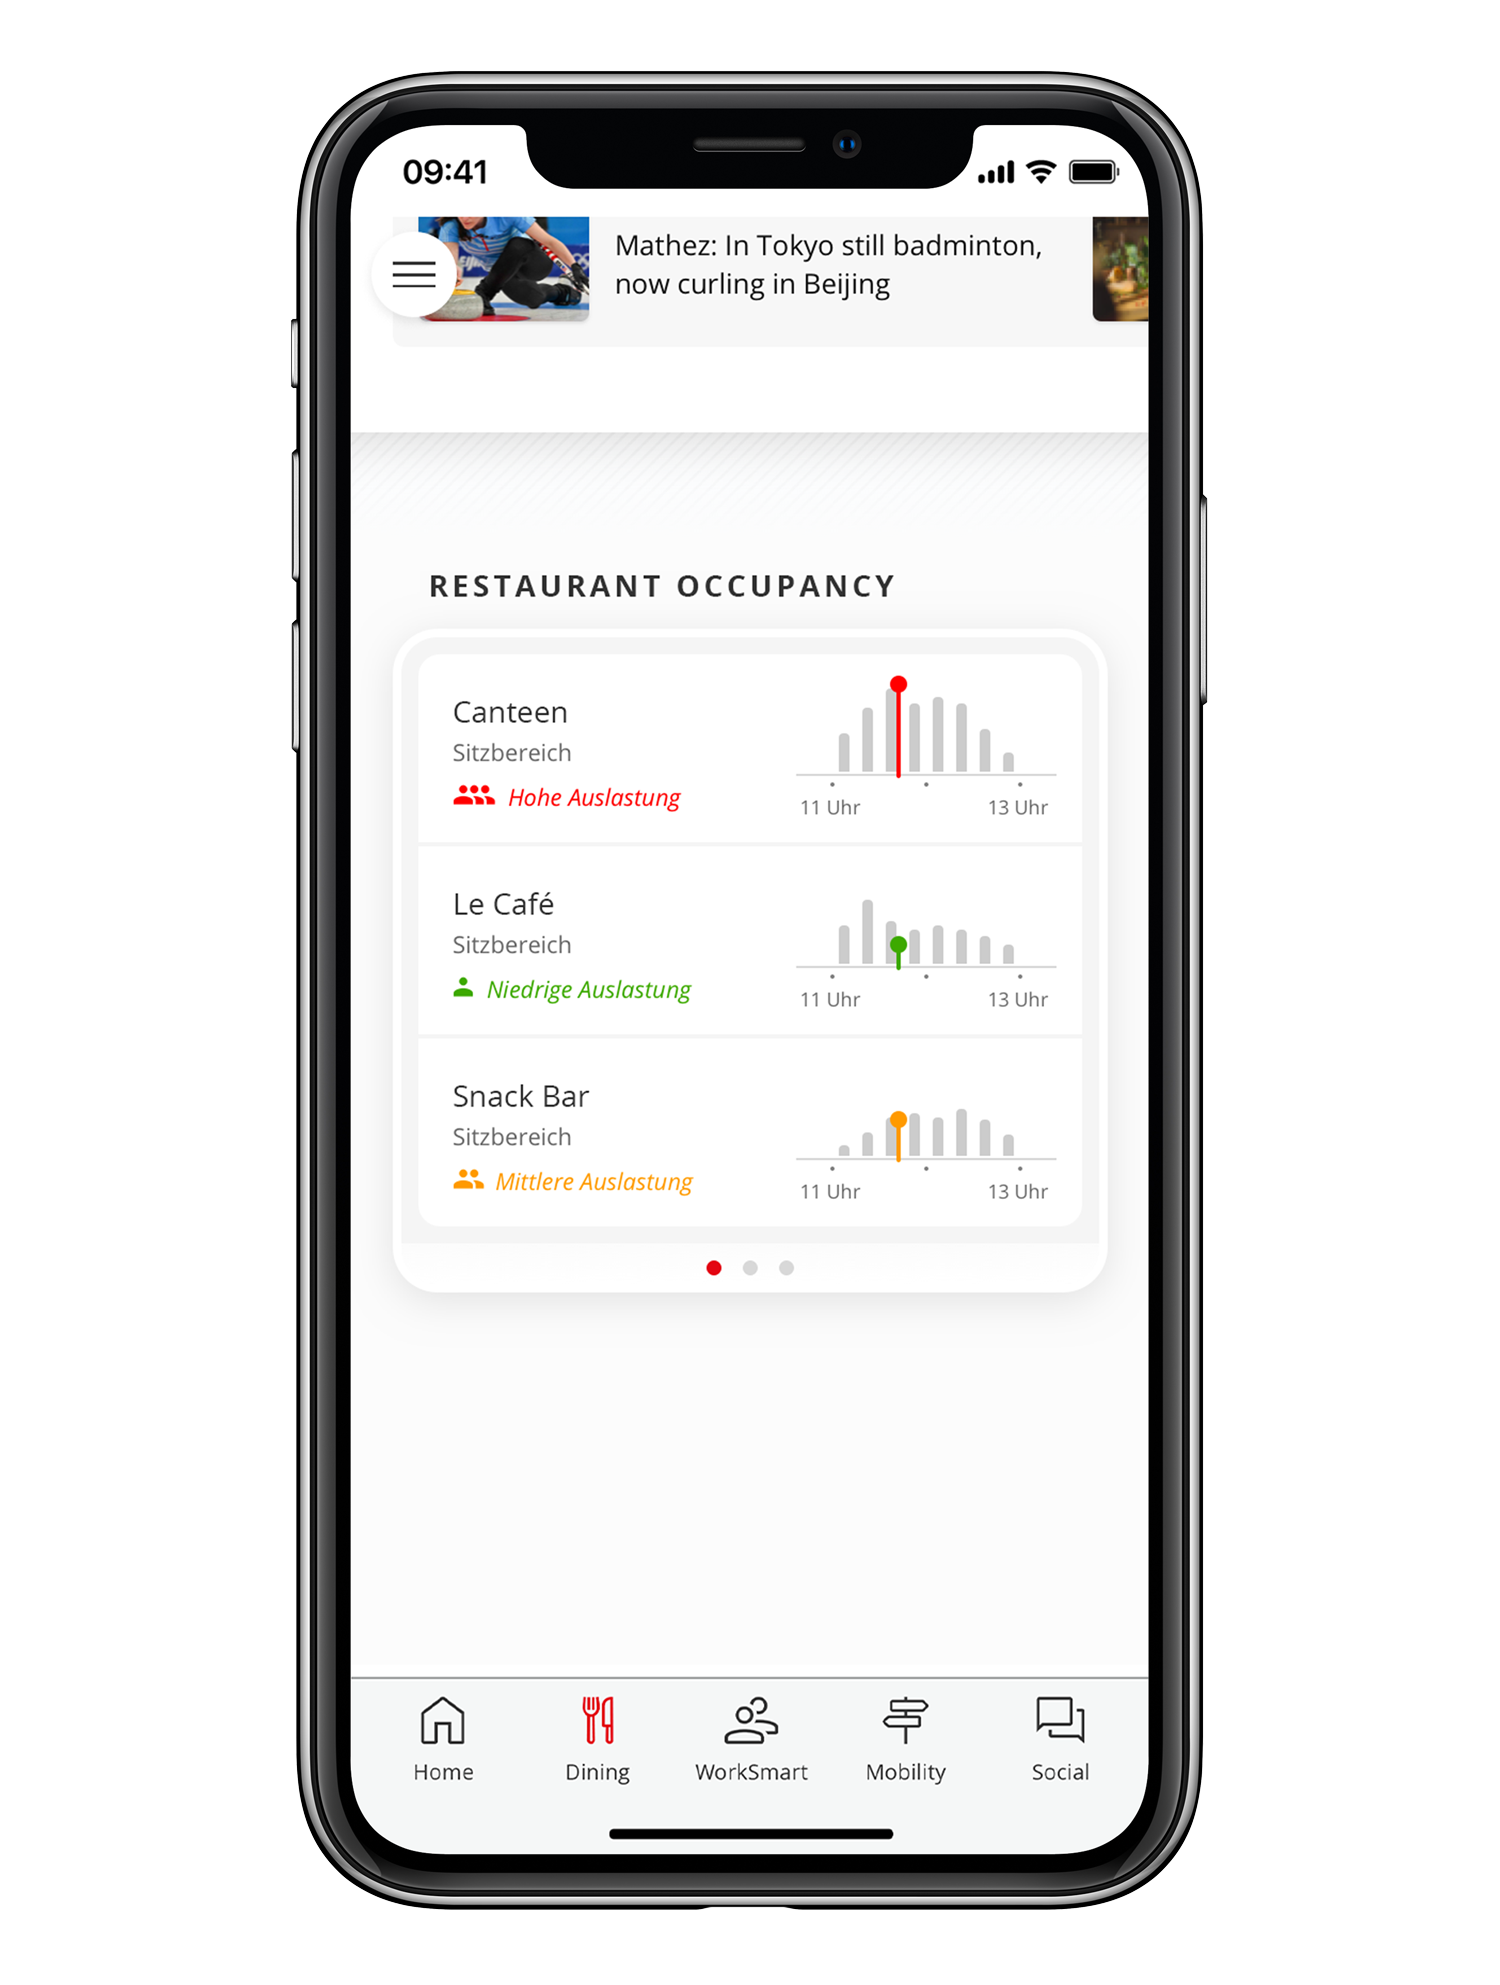
Canteen Utilization
The menu item “Dining” shows occupancy displays for all restaurants on the company’s premises. Current and historical occupancy rates can be viewed. Predicted future occupancy rates and periods of typically high occupancy are highlighted in the application.
The selected restaurant’s future and historical values for highly frequented times of day are displayed using a column diagram. In addition, the occupancy statistics of the other restaurants at the location are graded as low, medium, and high. On request, available seats can also be displayed.
Parking Space Utilization
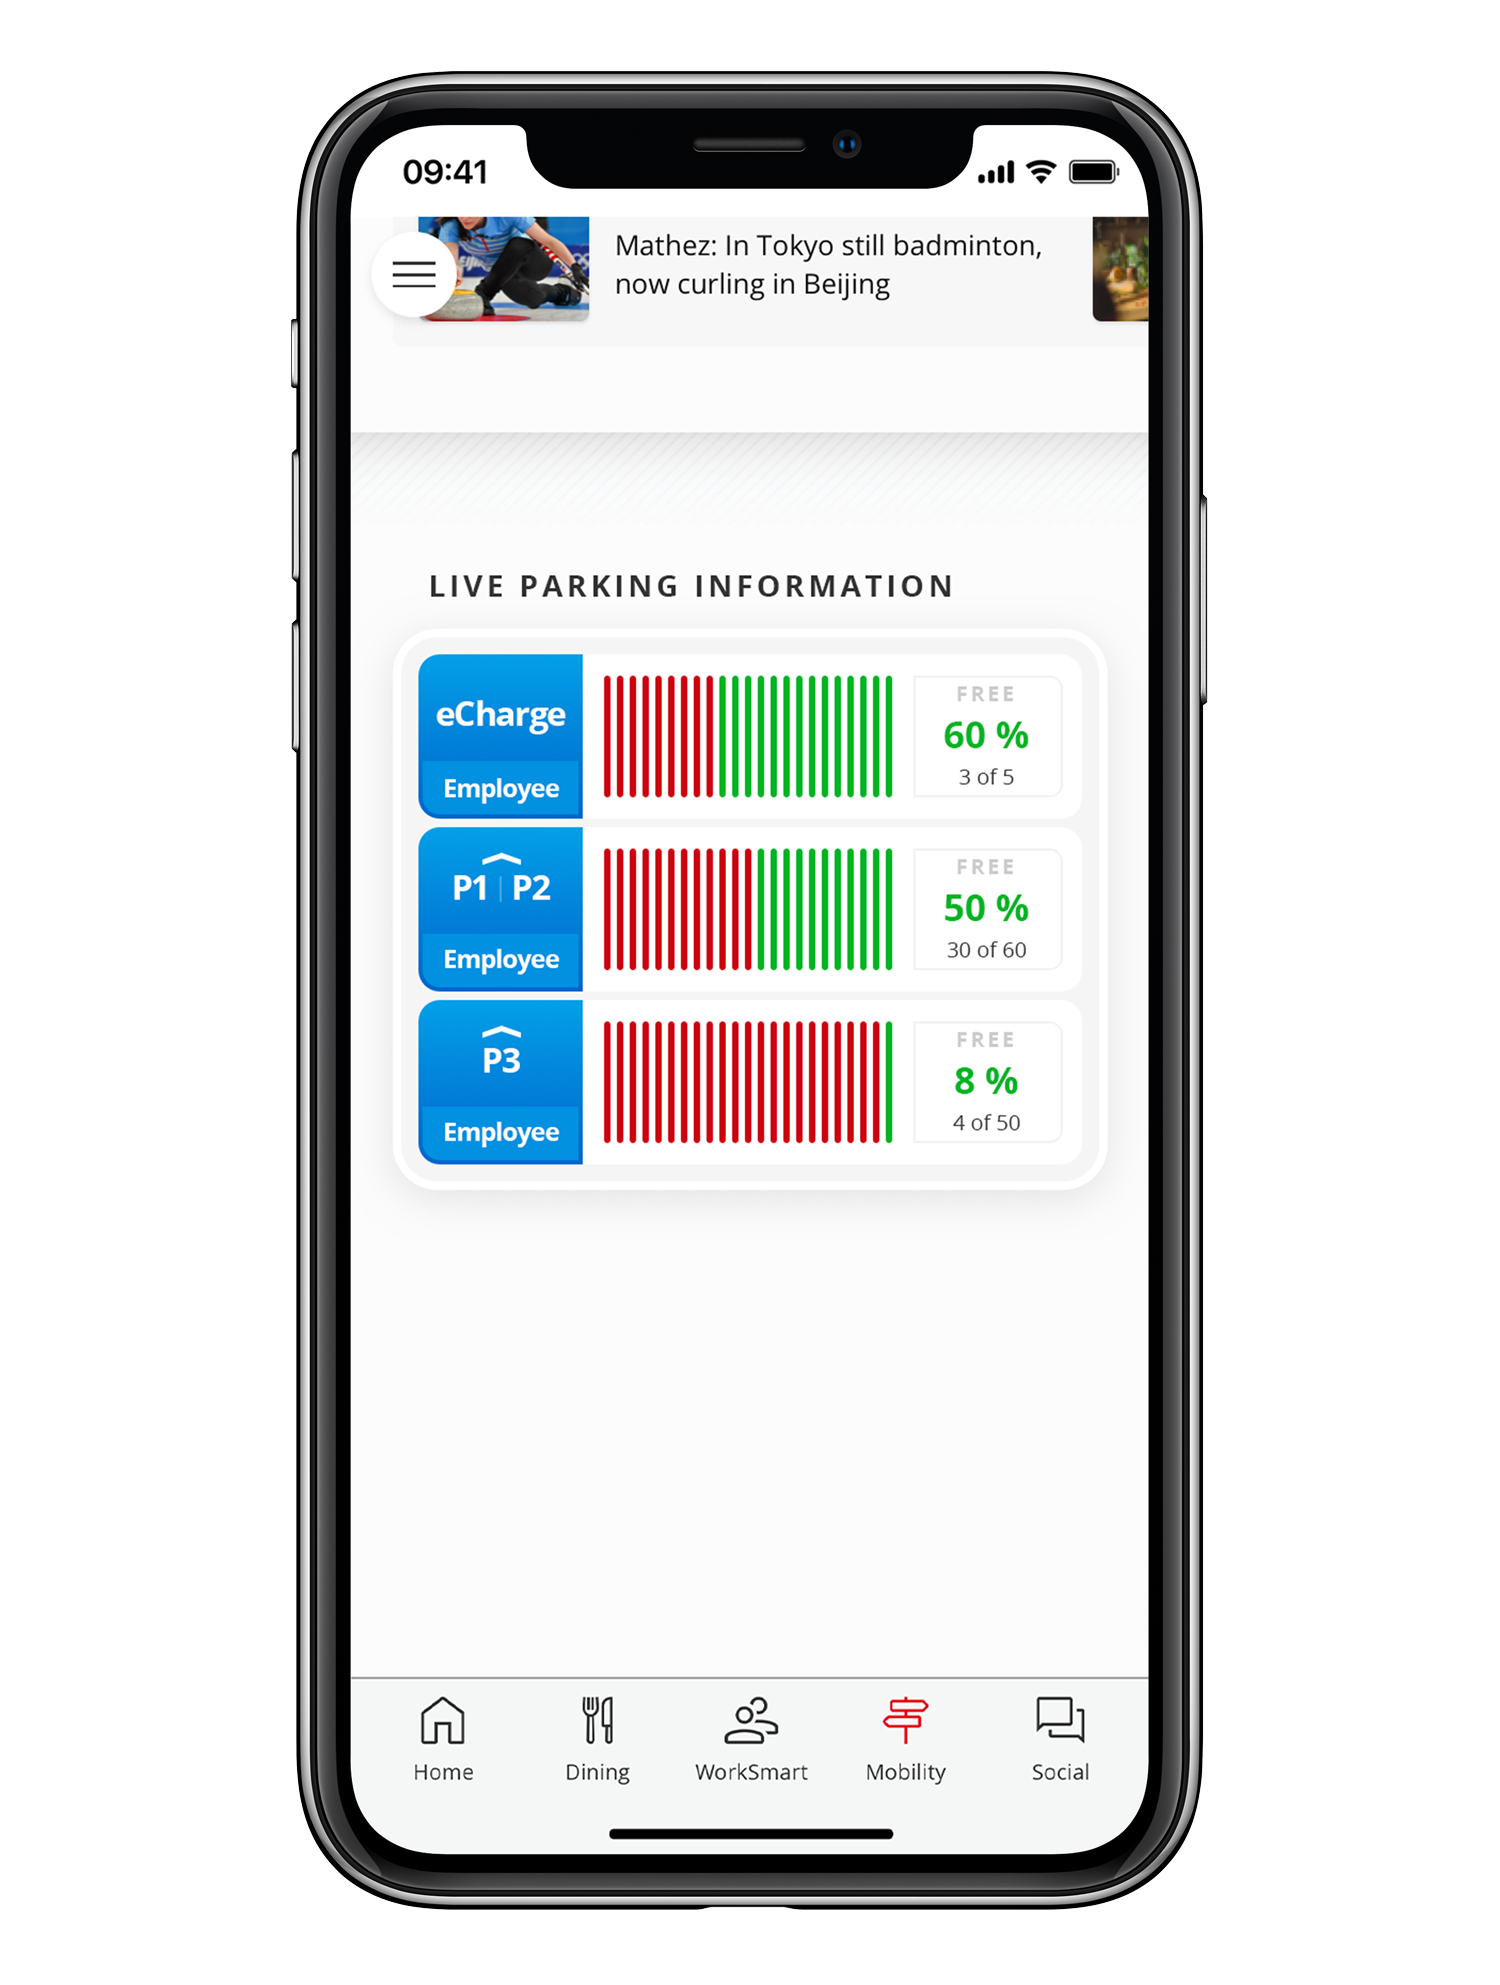
The “Mobility” section provides the user with an overview of the current parking situation on the company site. Utilization reports are displayed for different car parks. The car parks are also clearly divided into parking levels to provide clear occupancy information. Special parking areas, such as parking spaces with electric charging points, are also specially marked so that availability can be checked at a glance.
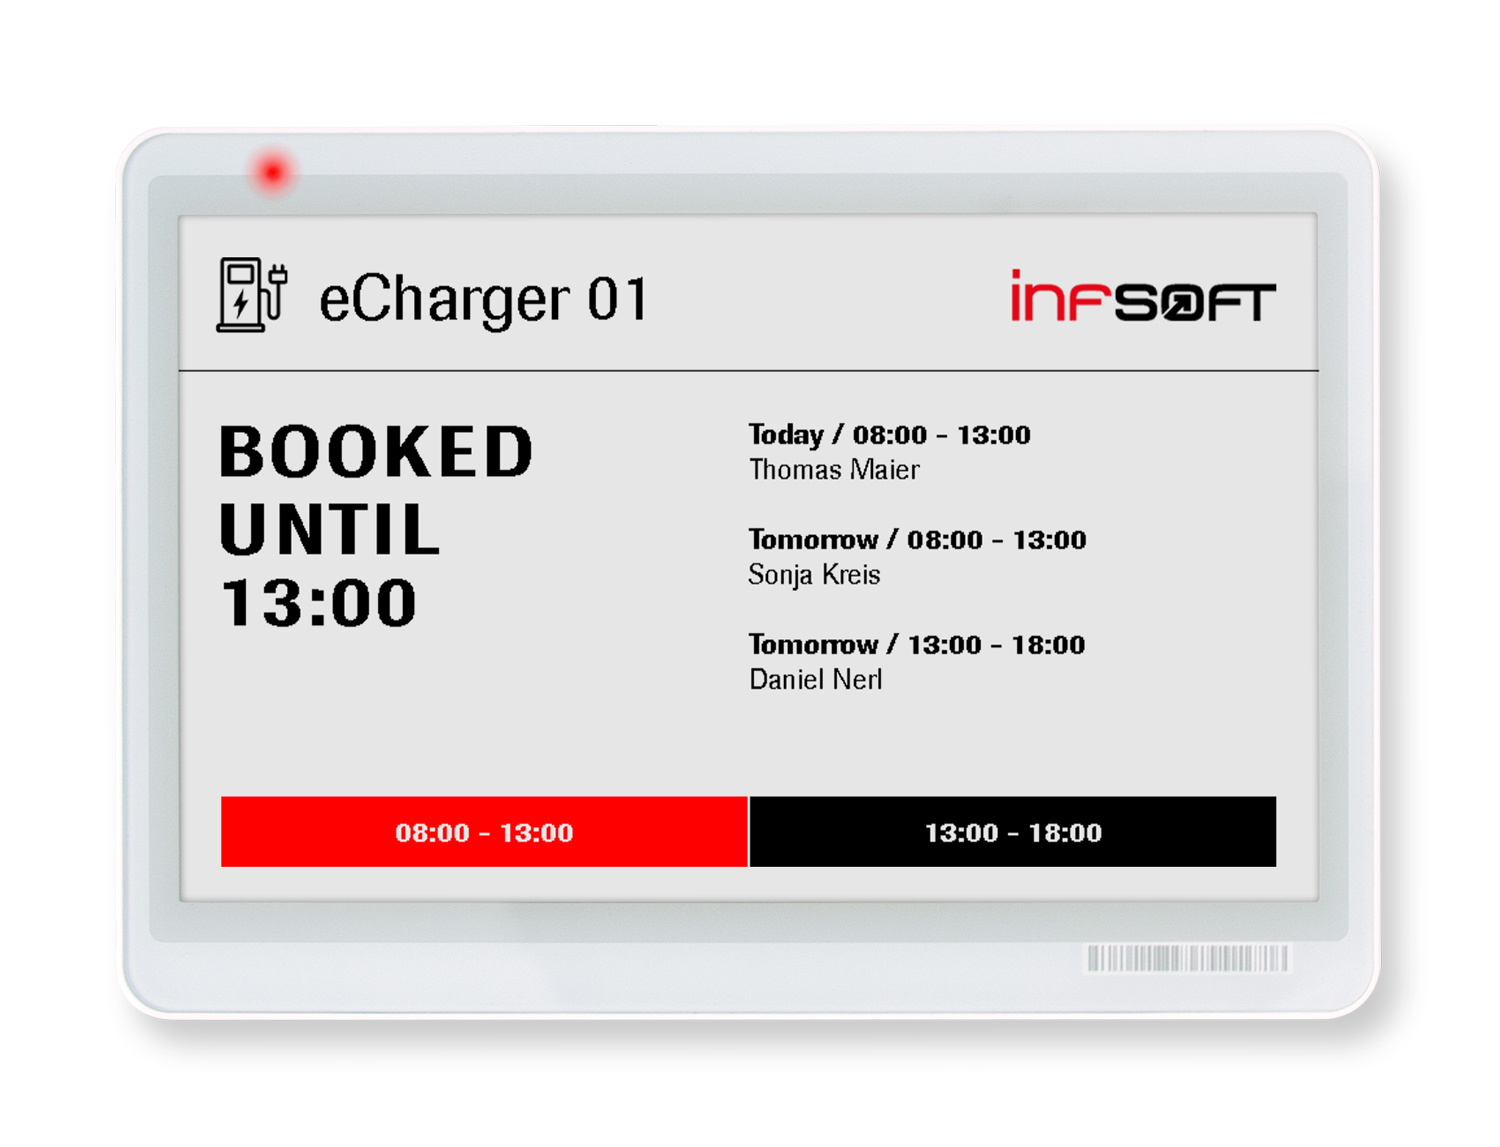
The analysis data is displayed per parking area and may optionally be further segmented. Charging stations can optionally be provided with infsoft E-Ink Display Beacons to display booking information not only within the app but also on-site.
E-Ink Displays as an additional form of Visualization
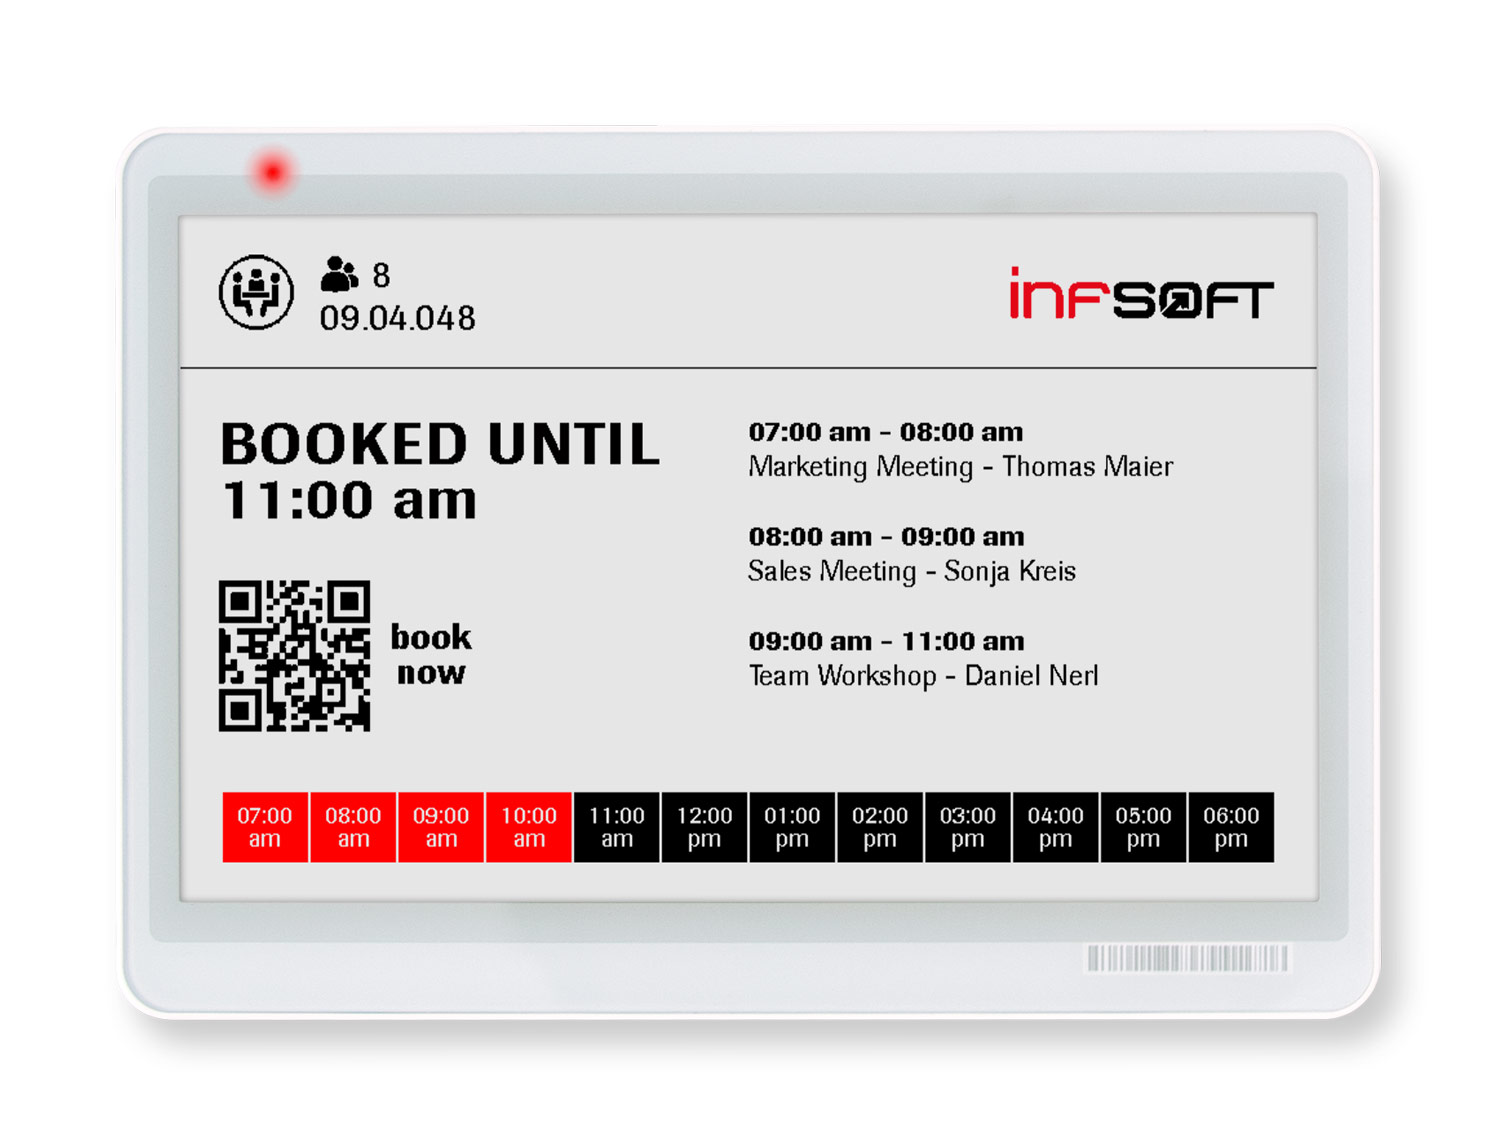
For many of the featured occupancy screens, the infsoft E-Ink Display Beacon provides an additional way to share various live occupancy information. For example, it can be attached to restaurant tables to provide visitors with current occupancy information in the app and on-site. It can also be used for workstations or eChargers. The combination of e-ink display beacons and the Workplace Experience App allows live occupancy and utilization information to be accessed online and offline.
To find out more about the basics of occupancy analytics or the Workplace Experience App, please visit the relevant product pages or contact us.


